Guides


To find products to sell with Google Trends, type a product idea into the Explore page, set the time range to five years and your target country, and keep only ideas whose line has risen for more than one season. Then check the related queries on the Rising tab for the sub-product people actually search for. Google Trends tells you the direction of demand for free. It will not tell you the size, so you finish the decision with a volume number from somewhere else.
That last sentence is the whole problem with googling "google trends products" and following the advice you get. Below is the six-step version that ends in a yes or a no, worked on real product terms and real monthly search volumes.
Key takeaways:
Let's get into it.
Google Trends is a sample of real Google searches, but the chart is an index, not a count. Google's own FAQ about Google Trends data spells out the arithmetic: each data point is divided by the total searches of the geography and time range it represents, and the results are "scaled on a range of 0 to 100 based on a topic's proportion to all searches on all topics."
Three consequences matter when you are picking stock.
Google says plainly that its data "should always be considered as one data point among others." That is the honest framing, and it is why every step below ends in a number rather than a picture.
Here is the whole method on one card before we work through it.
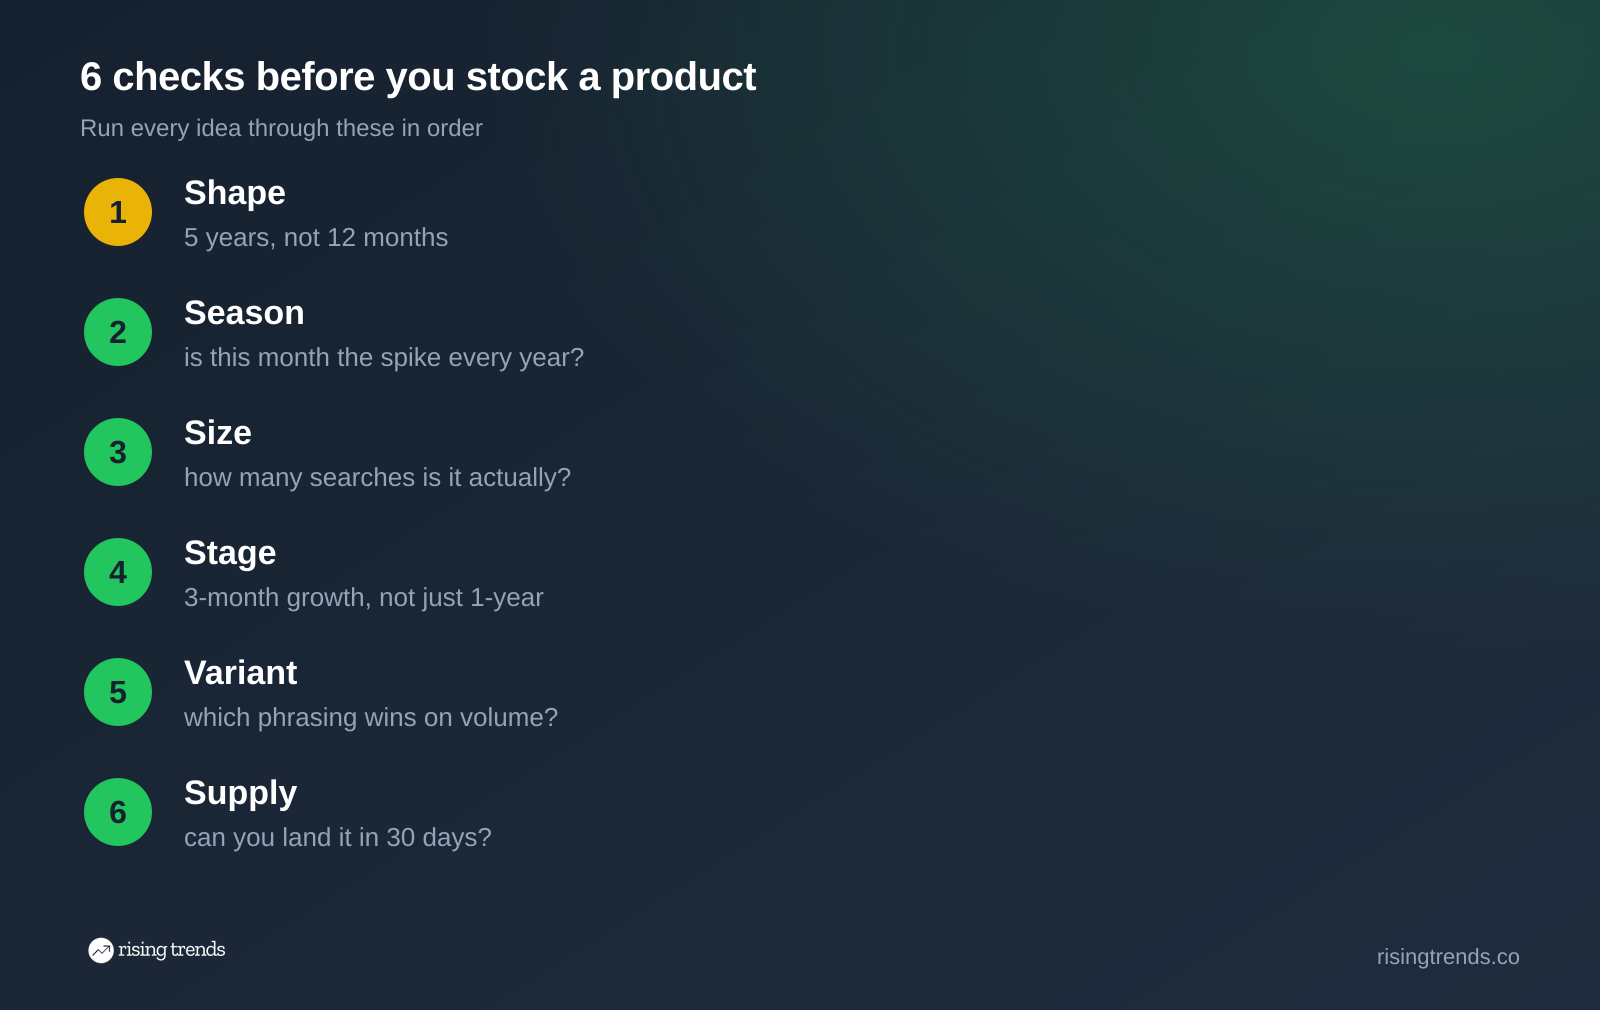
Each check is a separate way for a product idea to die, in roughly the order that kills ideas fastest.
Google Trends is a validation tool. It is poor at generating ideas, because you have to already know the words to type.
So begin somewhere that hands you candidates. Options that work:
Pull 15 to 20 candidates. Most will fail step 2, and that is the point. If you want the longer version of this sourcing stage, our walkthrough on finding trending ecommerce products covers where the lists come from.
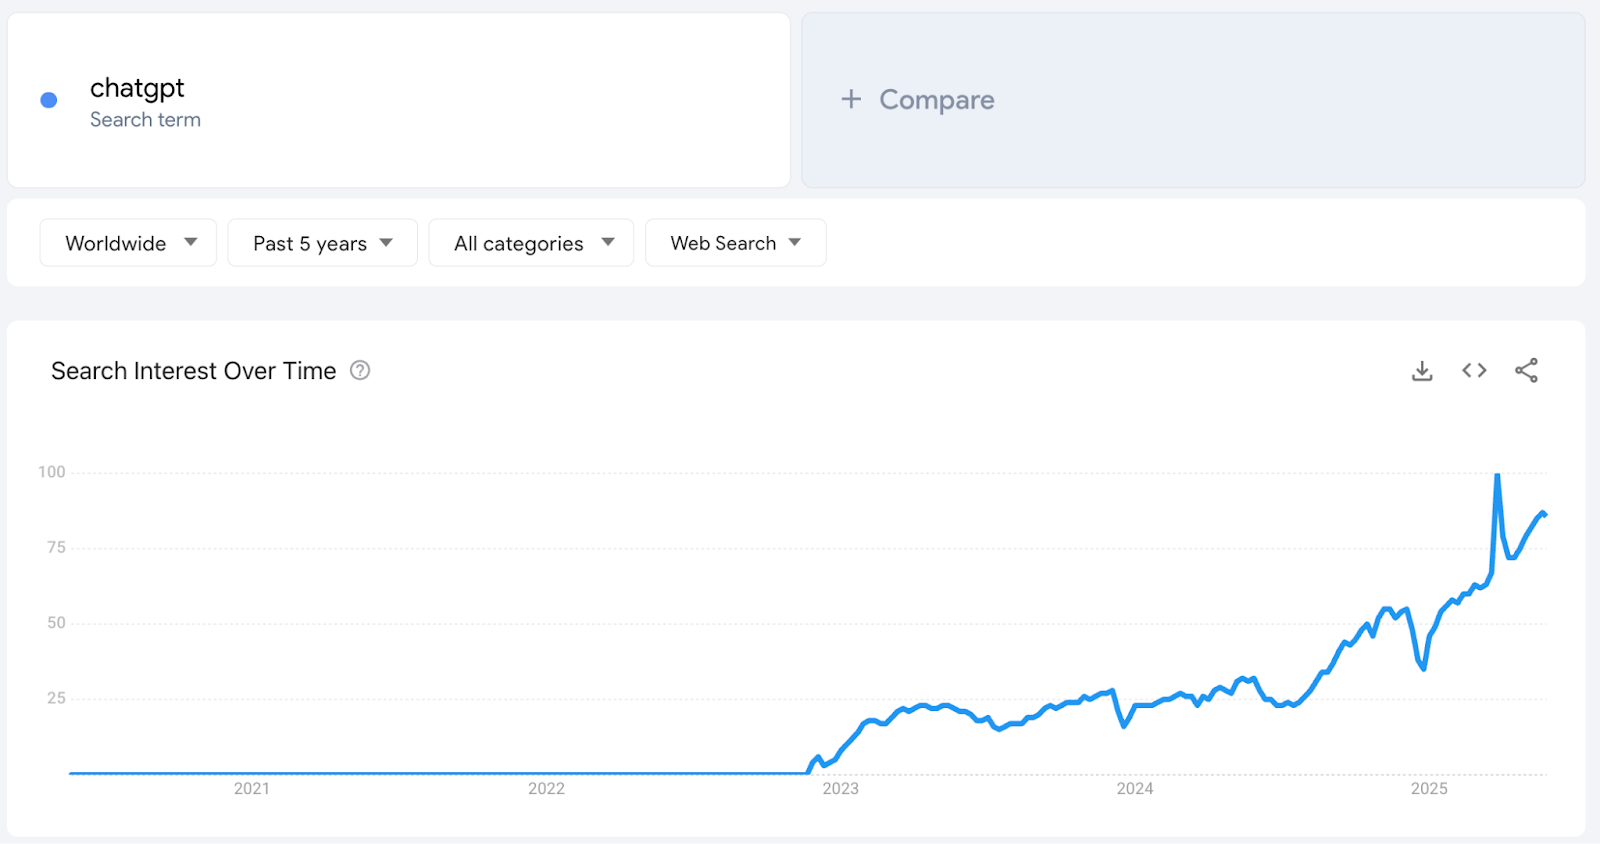
Open trends.google.com, type the term, and change two settings before you look at anything: time range to Past 5 years, and region to the country you ship to.
Twelve months is the default and it is the single most common mistake in product research. It cannot distinguish a product that is growing from a product that is simply in its season.
What you want on a five-year view:
What you do not want:
Google Trends is genuinely good at this, it is free, and nothing we sell replaces it. The same five-year read is how our guide to using Google Trends to find profitable niches frames a category, and the market research version applies it to competitors.
A product can pass the shape test and still be a calendar, not a trend. The way to catch it: compare the last three months against the same three months a year ago, not against the spring.
Take lunchbox, a perfectly good product with a very misleading short-term chart. Here is what our database has:
| Window | Growth | What it suggests |
|---|---|---|
| Last 3 months | +123% | Breaking out |
| Last 12 months | 0% | Flat |
| Last 24 months | 0% | Flat |
Searches for lunchboxes sit at 165,000 a month for most of the year, climb to 301,000 in July and 368,000 in August, then fall back. The same July and August peak is there in 2024 and in 2025. The lunchbox trend page shows every month side by side, which is the quickest way to see that this year's spike is last year's spike.
The rule: if three-month growth is strongly positive and one-year growth is near zero, you have found a season. That is still useful. It tells you when to buy and when to discount. It is not a reason to enter the category.
This is where the free tool runs out, and it is the step the ranking guides skip. They tell you to look for a rising line and then say nothing about how big a rising line has to be.
Watch what happens when you attach volumes to two charts that look similar on Google Trends.
First, dumpling squishy, a product that exploded out of nowhere in late 2025.
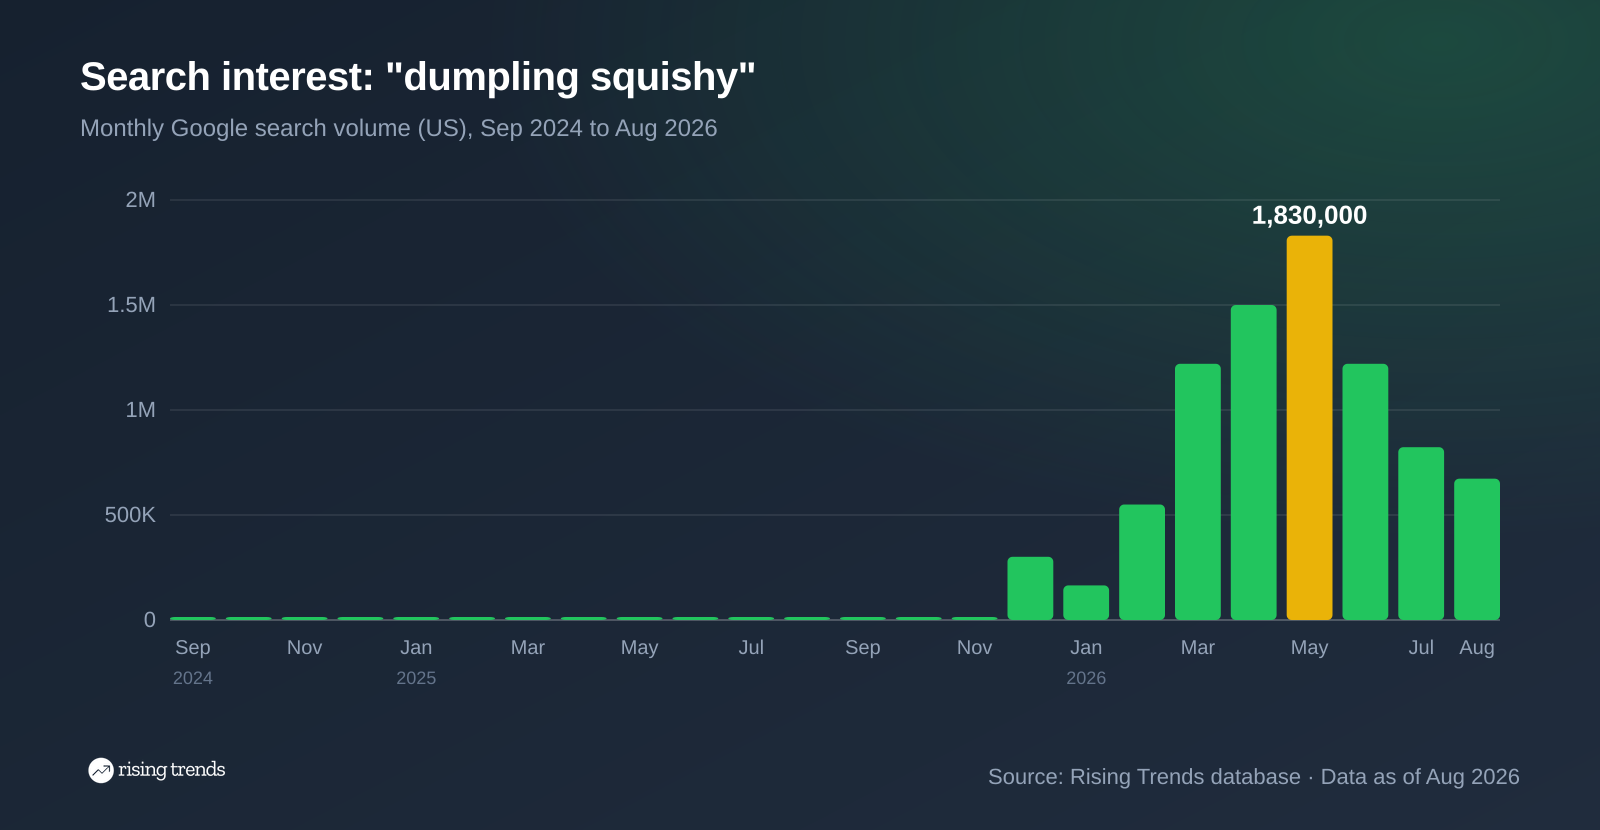
Flat at around 1,600 searches a month for two years. Then 8,100 in November 2025, 301,000 in December, and a peak of 1,830,000 in May 2026. By August it was back to 673,000, down 63% from the peak in three months. Anyone who ordered a container in April took delivery into a falling market.
Now squishies, the category term sitting above it.
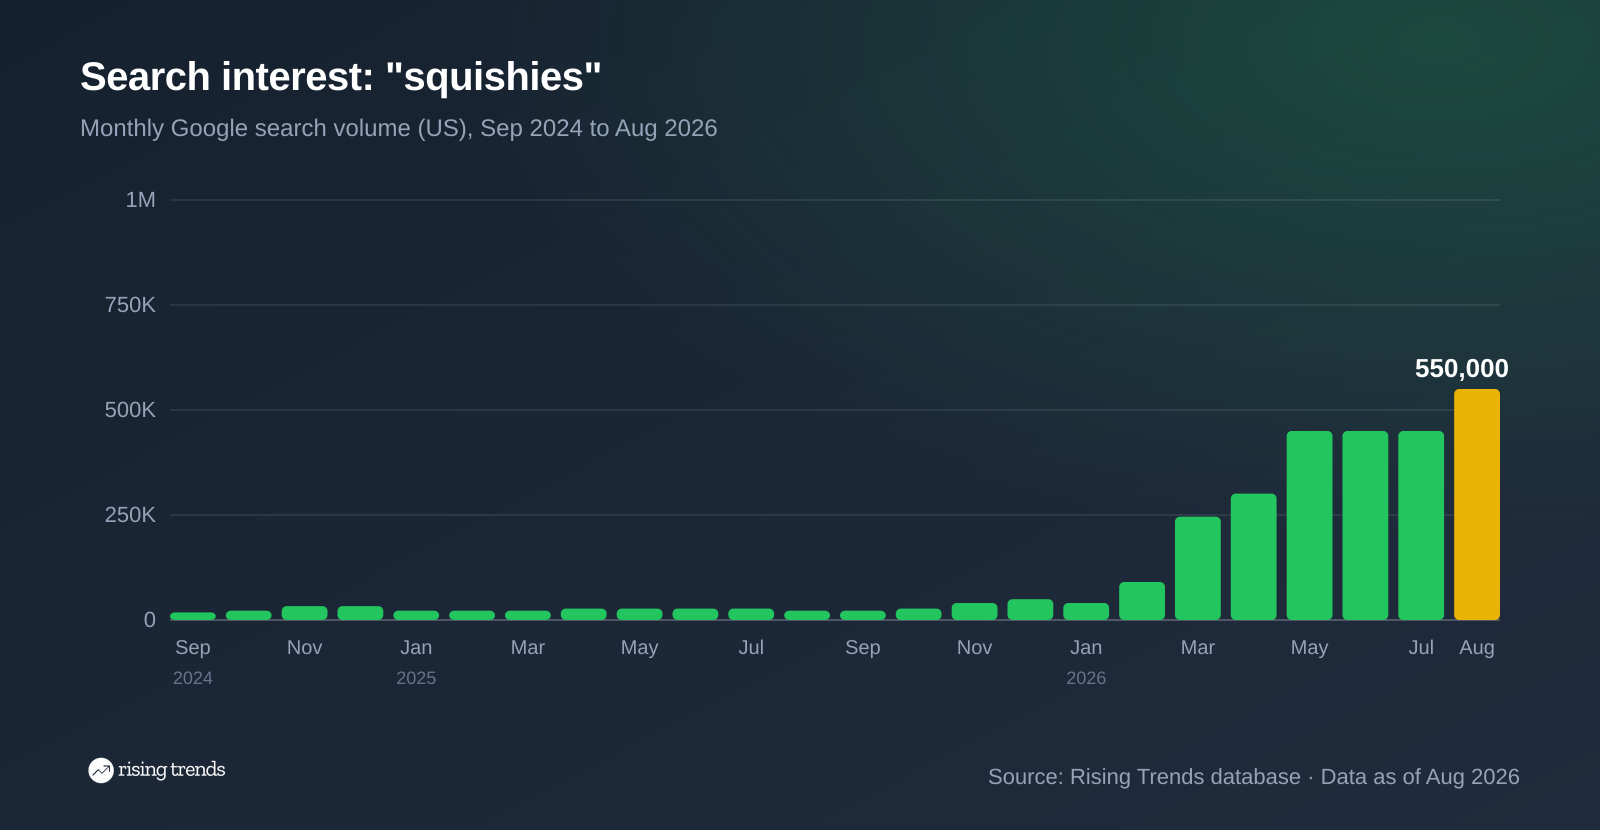
Same two years, different story: 22,200 a month, then a steady climb to 550,000 in August 2026, still at its high and still up 22% over the last three months.
Here is the part Google Trends structurally cannot tell you. The product that crashed is still bigger than the category that is healthy: 673,000 searches against 550,000. On two separate Explore pages, both of these are a line that tops out at 100. The index has no way to say that one of those 100s is worth three times the other.
Attaching real volume is the gap our database fills, and the only place in this process where we are the answer. Every tracked term has its US monthly searches and its 3-month, 1-year and 2-year growth on one trend page, updated monthly. If you want the thinking behind the threshold rather than the tool, we wrote it up under validating market demand.
A working floor for a physical product in a single country: 5,000 monthly searches for the head term before you pay for inventory. Below that you are buying a hobby.
Year-over-year growth tells you something happened. It does not tell you whether it is still happening. For that you need a short window next to the long one.
Run both numbers on every finalist:
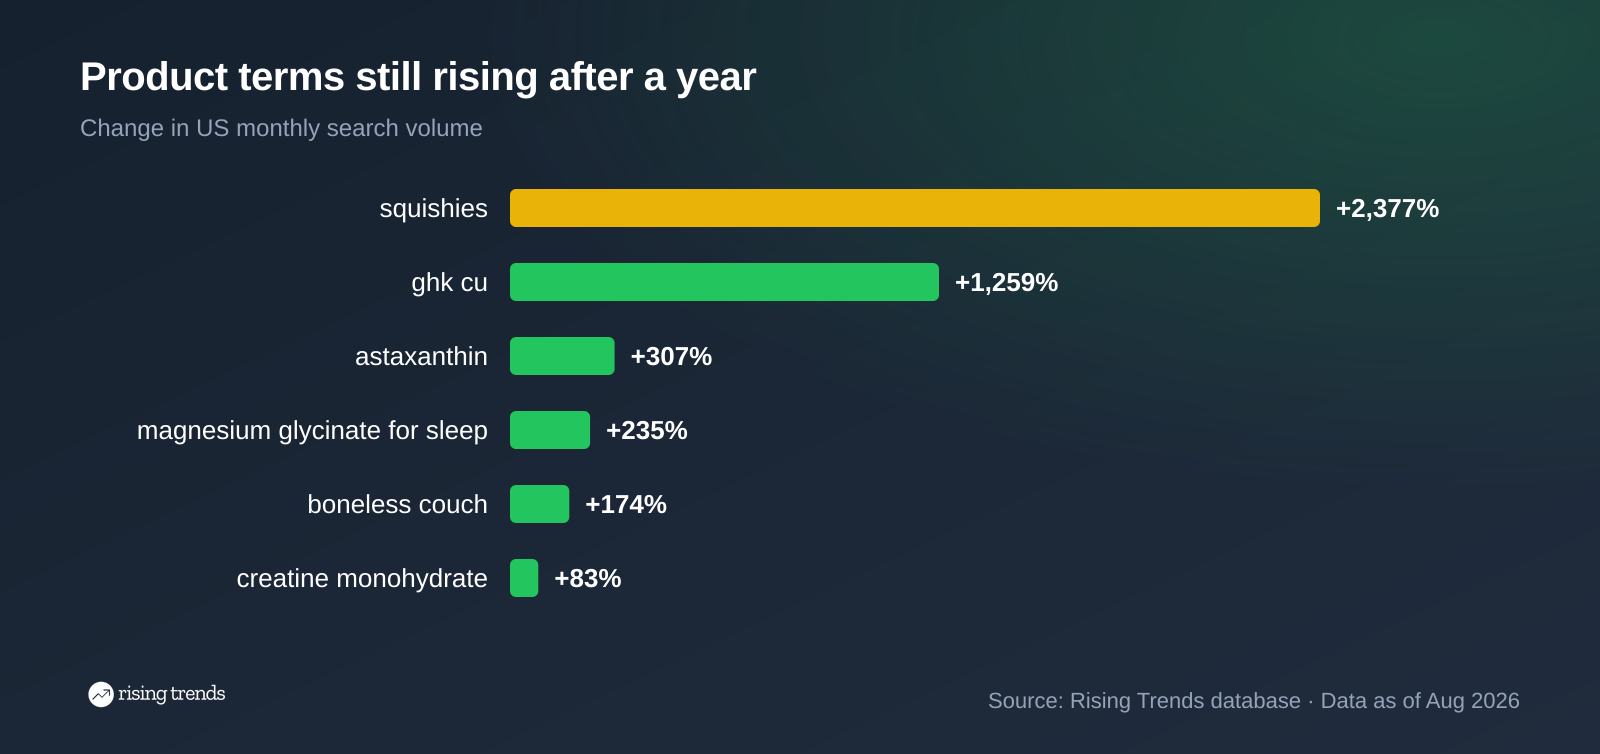
Every term on that chart was also up in the last three months, which is why they are on it. Note the bottom bar. Creatine monohydrate grew 83% in a year, the smallest number on the chart, off a base of 165,000 searches to 450,000 a month today, with every month above the same month a year before. That is a far safer product than the 2,377% at the top, and the pattern repeats across the supplement aisle, as the creatine HCl trend shows at the variant level. For the fad end of the same spectrum, the taba squishy trend is the same shape as the dumpling, one wave earlier.
While you are in the related queries, treat Breakout with suspicion. Google's own training on Google Trends data defines it as growth "more than 5000%", which a term reaches by going from 20 searches to 1,100. It is a growth rate wearing a badge, not a verdict.
You have a category. Now choose the exact product and the exact words, because that decision sets your listing title, your ad copy and your SKU.
Compare up to five phrasings in one Google Trends chart to get the ranking, then attach volumes to decide whether the gaps are worth anything.
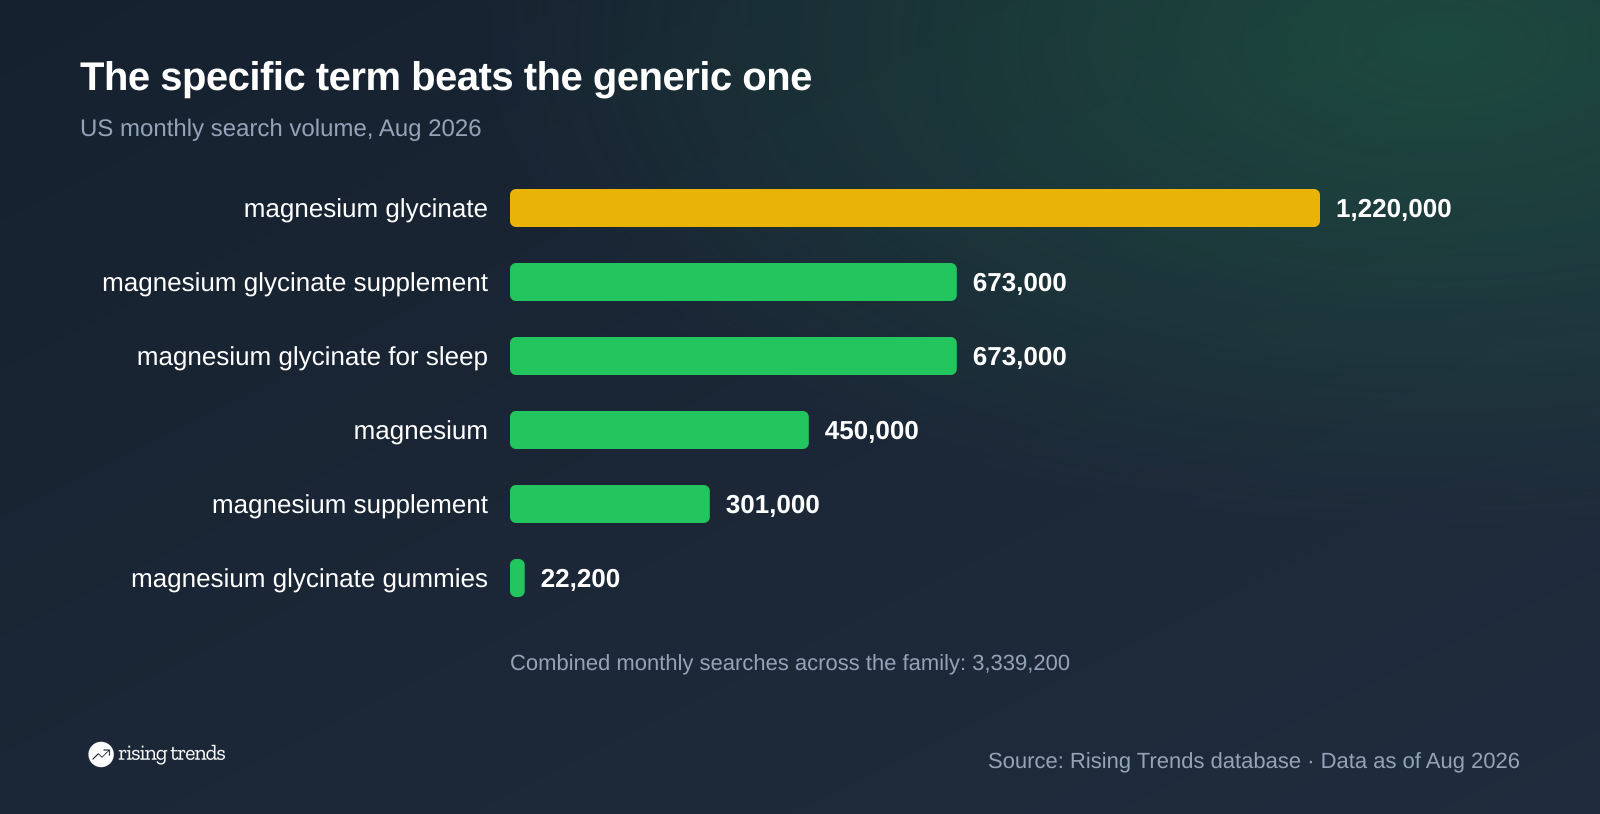
Three decisions fall out of that one chart.
Run the same comparison inside whichever vertical you are in. The supplement trends page lists the terms moving in this one.
Doing six checks on twenty products by hand is a morning. Doing it every week is a job, so it stops happening by month three.
If you want it automated, the Trends API runs the filters from steps 4 and 5 in a single request. This asks for non-brand physical products over 1,000 monthly searches that grew more than 100% in the last year, sorted by growth:
curl -H "Authorization: Bearer rt_live_..." \
  "https://www.risingtrends.co/api/v1/trends?is_ecom=true&is_brand=false&min_search_volume=1000&min_growth_pct=100&timeframe=1y&sort=growth"
Change timeframe to 3m and you get step 5's short window instead, which is the query that separates the products still climbing from the ones already rolling over.
Take a list of candidate products from somewhere else, then use Google Trends to eliminate them. Set the range to five years and the region to your market, keep only the terms whose yearly floor keeps rising, check that the recent jump is not the same jump that happened last year, then attach an absolute monthly volume and a three-month growth figure before you buy anything.
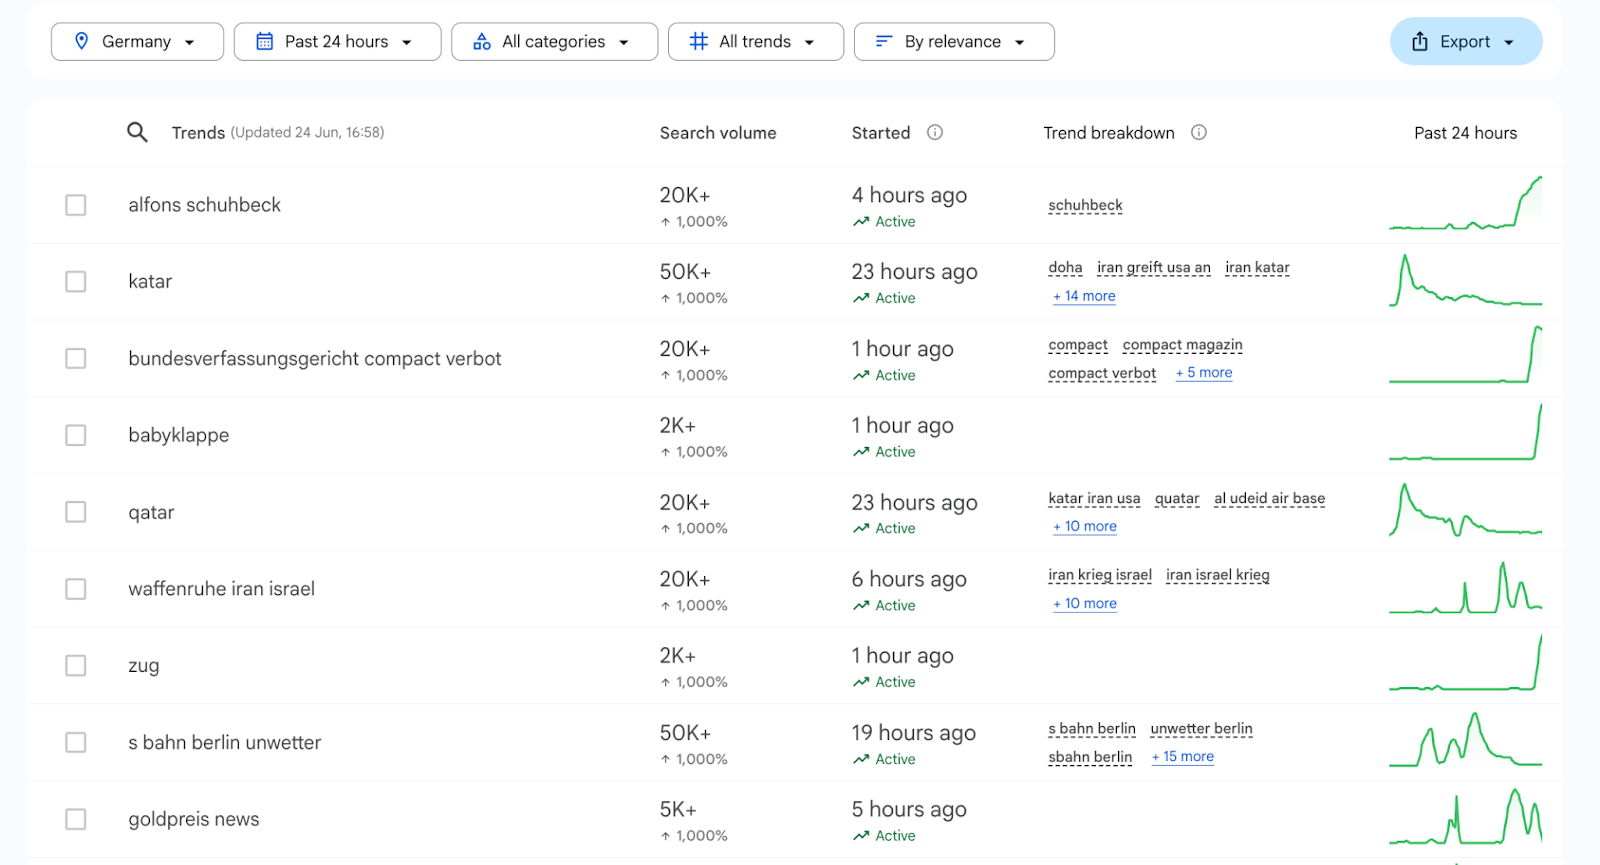
Google Trends has no list of trending products. It has Trending Now, which is news-driven and measured in hours, and related queries on the Rising tab, which only work once you have typed a term. For a standing list of product terms with volumes attached, the trending topics feed is updated weekly.
Any fixed list of ten is out of date within a quarter, which is the main weakness of the product roundups that rank for this query. As of August 2026, the product terms in our database with both strong yearly growth and positive three-month growth include squishies at 550,000 monthly searches, magnesium glycinate for sleep at 673,000, astaxanthin at 301,000 and boneless couch at 301,000. The useful artefact is the filter, not the list.
Navigational queries, mostly: people typing "youtube" or "facebook" into the search bar instead of the address bar. It changes little and tells you nothing about what to sell, because nobody is shopping when they search it.
No, and it is not an oversight. The public Explore page returns a 0 to 100 index by design. Google does expose real numbers to merchants in other products, including the Shopping trends report in the Content API, but that is scoped to merchants and categories rather than to arbitrary search terms.
Five years for a product decision, and 2004 to present when you want to know whether a category is structurally growing or just cycling. Twelve months is only useful once you already know the shape of the longer series.
Region, time range, category and search type. The category filter removes homonyms, and switching search type to Google Shopping gives you shopping intent rather than research intent, which is a meaningfully different signal for a seller. Google's Explore page documentation covers what each control changes.
Want the volume number behind every term in this guide? Read our guide on how to identify market trends, open the live squishies trend page, or browse what is breaking out right now on the Rising Trends dashboard.
Thousands of Emerging Trends
Thousands of Breakout Apps
Mega Trends
Trend Analysis Tool