

To find trending products with AI, stop asking the chatbot what is hot and start giving it data to filter. Connect Claude or ChatGPT to a search-volume database, ask for product categories that are growing, make it pull five years of monthly numbers for each one, cut anything seasonal, flat, brand-only or built on a single spike month, then rank what survives by sales rather than searches. Five steps, about 25 minutes, and every product you end with carries a volume, a curve and a monthly sales figure.
Key takeaways:
- An AI tool that returns "winning products" from memory is guessing. The model has no way to know whether a term got searched more this month than last. Attach a data source before you ask anything.
- The method is five steps: ask for rising categories, widen the scan, pull the full curves, cut the fakes, then check the money columns.
- Most big growth numbers are one month wide. "Ascorbic acid serum" sat near 200 searches a month for two years, jumped to 74,000 in July 2026 and has not moved since. That reads as +43,429% growth in a year.
- A real climb looks boring. "At home devices" went from 20 monthly searches in November 2024 to 5,400 in October 2026 without a single month more than tripling.
- Searches and sales are different things. "At home devices" has the smallest search volume on our shortlist and the biggest Amazon sales, at 18,550 units a month across the category.
- A low rating on a rising category is a buying signal. "Squeezy squishy" grew to 27,100 monthly searches with an average rating of 3.88, which means demand is there and the products are not.
Let's get into it.
Why asking ChatGPT for trending products does not work
Type "what products are trending right now" into a chatbot and you get a confident list. The list came from training data. The model cannot tell you whether anyone searched for those things last month, or whether the spike it half-remembers was a single viral week in 2024.
The pages that rank for this question mostly sell you a way around that. The top three results today are tool roundups: six AI product finders here, ten affiliate-linked dashboards there, and a walkthrough that eventually sends you to Google Trends. None of them shows an actual session where the AI checks a number.
And Google Trends, the free fallback everyone recommends, cannot give you a number at all. Google's own documentation says Trends "normalizes search data" and scales results "on a range of 0 to 100 based on a topic's proportion to all searches on all topics". A line that rises from 20 to 80 tells you nothing about whether that is 200 searches or 200,000. Low-volume terms simply show as zero.
The fix is to hand the assistant a database. The Model Context Protocol (MCP) is the open standard for that. The MCP documentation describes it as "an open-source standard for connecting AI applications to external systems", and compares it to a USB-C port for AI apps. Claude and ChatGPT both support remote MCP servers now.
Rising Trends runs one. Once the Rising Trends MCP for Claude and ChatGPT is connected, the assistant can pull absolute US monthly search volume, five years of month-by-month history and growth over 3 months to 5 years, plus the Amazon side of a category: average price, units sold per month, revenue and customer rating. That combination is the whole method. The model does the filtering, the database supplies numbers it cannot invent.
Here is the method in one card:

Each step below follows that card in order.
Set up the connector (2 minutes)
You need a Rising Trends Pro account. As of November 12, 2026, Pro on the pricing page is a one-time $97 payment for lifetime access, and it includes the REST API and the Claude and ChatGPT connector.
In Claude:
- Open Settings, then Connectors, then Add custom connector.
- Paste
https://mcp.risingtrends.co/mcp. - Click Connect, sign in to Rising Trends and press Allow.
Claude's help centre says custom connectors using remote MCP work on Free, Pro, Max, Ultra, Team and Enterprise plans, with free users limited to one custom connector.
In ChatGPT: add a custom MCP server, paste the same URL, choose OAuth, sign in and press Allow. Then mention @Rising Trends in your message. In Cursor or Claude Code, create an API key and send it as Authorization: Bearer rt_live_... against the same URL.
This is the setup page, with the steps for each app:

Everything below is a real session run on November 12, 2026: real prompts, the real tool calls with their arguments, and answers built from what the database returned that day. The data runs through October 2026, and October is an early estimate. Every volume figure is US monthly searches.
Step 1: Ask for rising product categories, with filters
Start on the product side, not the idea side. Give the assistant hard filters in the first message, because "growing" means nothing without a window and tiny keywords are noise. A floor of 2,000 monthly searches keeps the list to things people actually look for.
Example conversation
You
I want to sell a physical product online. Find me product categories with at least 2,000 US monthly searches that grew most over the past two years. Include the average price, monthly sales and rating for each.
Claude calls the find_products tool:
find_products { "timeframe": "2y", "min_volume": 2000, "sort": "growth", "limit": 30 }
Claude
Top of the list by 2-year growth (US monthly searches, October 2026, which is an early estimate):
- luxe foundation: 301,000 searches, +1,504,900%, $23.79 average price, 9,100 monthly sales, 4.25 rating
- classroom resources: 1,220,000, +469,131%, $15.57, 3,200 sales, 4.69
- squeezy squishy: 27,100, +135,400%, $14.61, 5,000 sales, 3.88
- solar device: 246,000, +76,775%, $84.12, 2,600 sales, 4.29
- at home devices: 5,400, +53,900%, $43.56, 18,550 sales, 4.45
- anti-wrinkle products: 450,000, +23,584%, $20.67, 36,000 sales, 4.45
- lymphatic drainage drops: 90,500, +18,754%, $25.09, 11,900 sales, 4.31
- powerpacks: 22,200, +15,757%, $24.91, 6,150 sales, 4.54
- coloring blanket: 18,100, +12,829%, $25.07, 535 sales, 4.27
- plug in solar: 22,200, +10,471%, $223.43, 1,855 sales, 4.42
One call, and every row already carries a price and a sales figure. It is still a list, not a decision. Half of those numbers will not survive step 4.
Step 2: Widen the scan to every rising term
Product categories are the Amazon view. Some things break out as a single product or a brand first and only become a category later, so run the same scan across the whole trends database. The find_trends tool takes a category, a type, a volume floor and a growth window.
Example conversation
You
Now do the same across all physical products, not just Amazon categories. At least 5,000 monthly searches, sorted by 2-year growth. Flag anything that is a brand or has too little history to judge.
find_trends { "type": "physical", "timeframe": "2y", "min_volume": 5000, "sort": "growth", "limit": 20 }
Claude
A warning before you read this list. The top results are: collagen supplements, foundayo, nike mind 001, cottage cheese, vizz eye drops, deflock camera, yozma in 10, Celsius Drink, xiaomi 18 pro max, drillbit, dyson airsmooth, nicotine pouches, kodak charmera, corvette zr1x, mellow comforter, snapmaker u1.
Nine of those sixteen come back with is_brand: true. You cannot start a business selling someone else's product name.
Every single one also returns seasonality: "not_enough_history", which is why the growth column reads in the millions of percent. These entries joined the database recently, so their 2-year growth is measured from a baseline that is really an absence of data.
My read: the product-category list from the first call is the better starting point. This one is useful for spotting a category forming around a product launch, and nothing else.
That is the reason to run step 2 even though it produces nothing to sell. Sorting any trend database by raw growth surfaces brand launches and brand-new entries. The same trap shows up in free tools, and our walkthrough of trend analysis covers how to read a baseline properly.
Step 3: Pull the full curve for every survivor
This is the step that separates the method from every tool roundup. A growth percentage is a ratio between two months. Ask for the months themselves.
The get_trends tool returns up to ten trends in one call, each with five years of monthly volume, growth over 3 months, 6 months, 1 year, 2 years and 5 years, a seasonality label, momentum, and whether the term is a brand.
Example conversation
You
Pull the full monthly history for the ten product categories. For each one, tell me in a single line what the curve actually looks like. Do not describe it as growth if it is one jump.
get_trends { "slugs": ["luxe-foundation", "classroom-resources", "squeezy-squishy", "solar-device", "at-home-devices", "anti-wrinkle-products", "lymphatic-drainage-drops", "powerpacks", "coloring-blanket", "plug-in-solar"] }
Claude
Data through October 2026. Every trend returns estimated_month: "2026-10", so the October figure is an early estimate.
- at home devices (5,400): a climb, not a jump. 20 a month through late 2024, 50 by October 2025, 210 in January 2026, 390 in May, 1,300 in June, 2,400 in July, 5,400 since August. Seasonality low.
- powerpacks (22,200): 140 a month through mid-2025, then 880, 1,600, 2,400, 5,400, 9,900, 14,800 month after month, and 22,200 since August 2026. Seasonality low.
- plug in solar (22,200): 170 in May 2024, over 1,000 by July 2025, between 18,100 and 27,100 every month since March 2026. Seasonality low, 3-month growth flat.
- lymphatic drainage drops (90,500): 480 in late 2024, climbing through 2025, 22,200 by March 2026, 90,500 since July. Seasonality medium.
- squeezy squishy (27,100): 10 to 20 searches a month until October 2025, then 70, 140, 260, 1,900, 22,200, peaking at 49,500 in June 2026 and back to 27,100. Down 33% over 3 months.
- coloring blanket (18,100): 140 through early 2025, 14,800 by May 2026, steady between 18,100 and 22,200 since. Seasonality medium.
- anti-wrinkle products (450,000): between 1,300 and 9,900 for two years, 14,800 in March 2026, 60,500 in April, 450,000 in May. Two steps, then flat.
- solar device (246,000): 320 in April 2026, 246,000 in May 2026. One month.
- classroom resources (1,220,000): 390 in November 2025, 60,500 in December. One month.
- luxe foundation (301,000): a genuine climb through 2026, but October triples September. I would wait for the confirmed figure before trusting that last month.
Read the last four lines again. Those are the four biggest growth numbers in the list, and all four are one step up a wall.
Here is what the wall looks like. "Ascorbic acid serum", another category from the same database, shows +43,429% growth over a year:
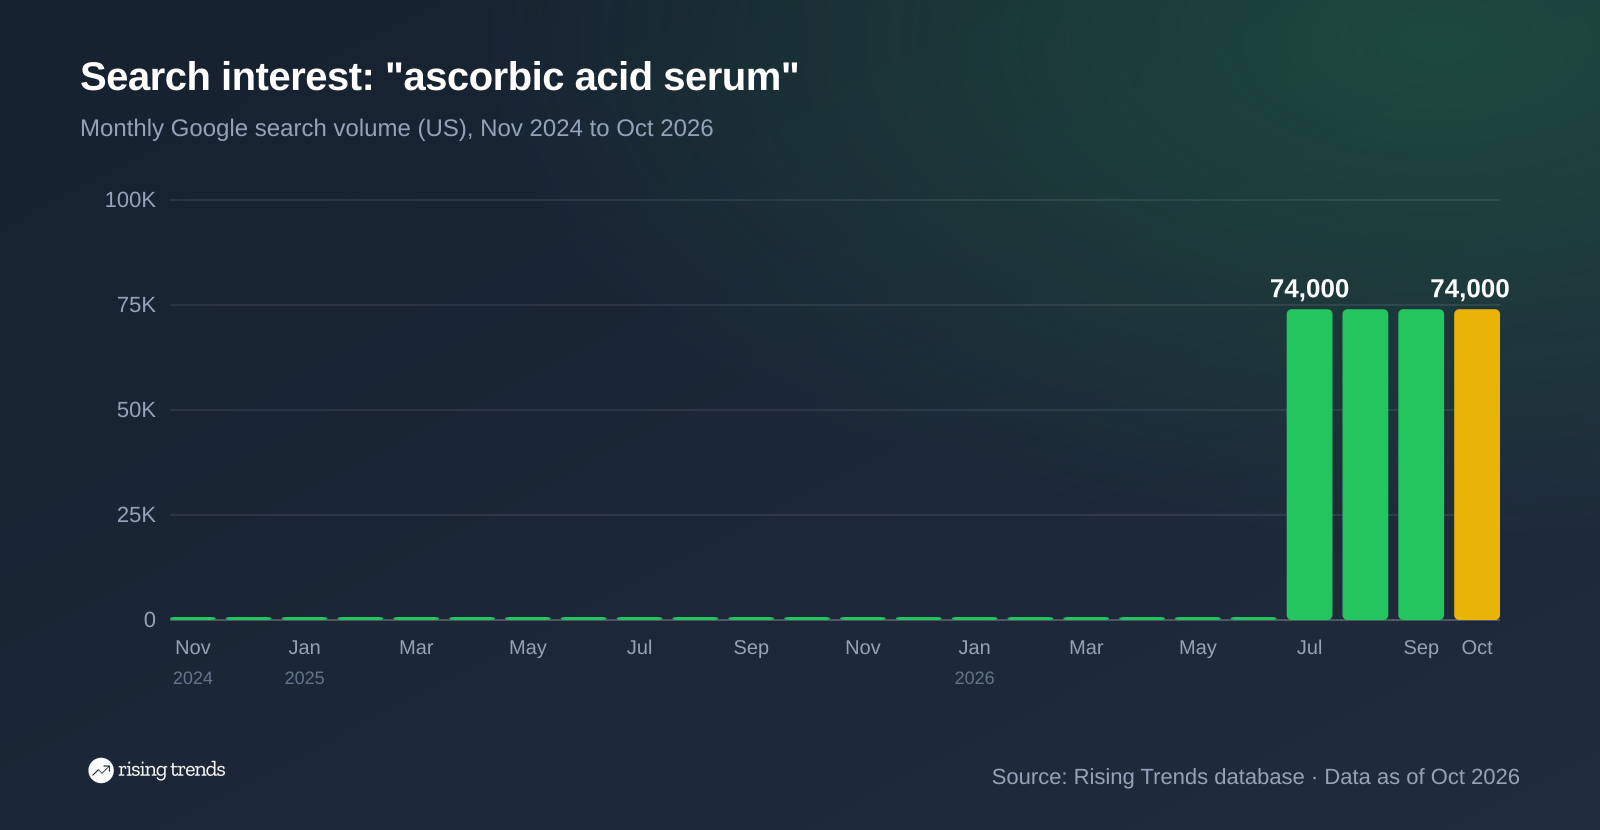
Two years near 200 searches a month, one jump to 74,000 in July 2026, then four identical months. Nothing is growing. Either way there is no trajectory to ride.
Now the same chart for a category that actually climbed:
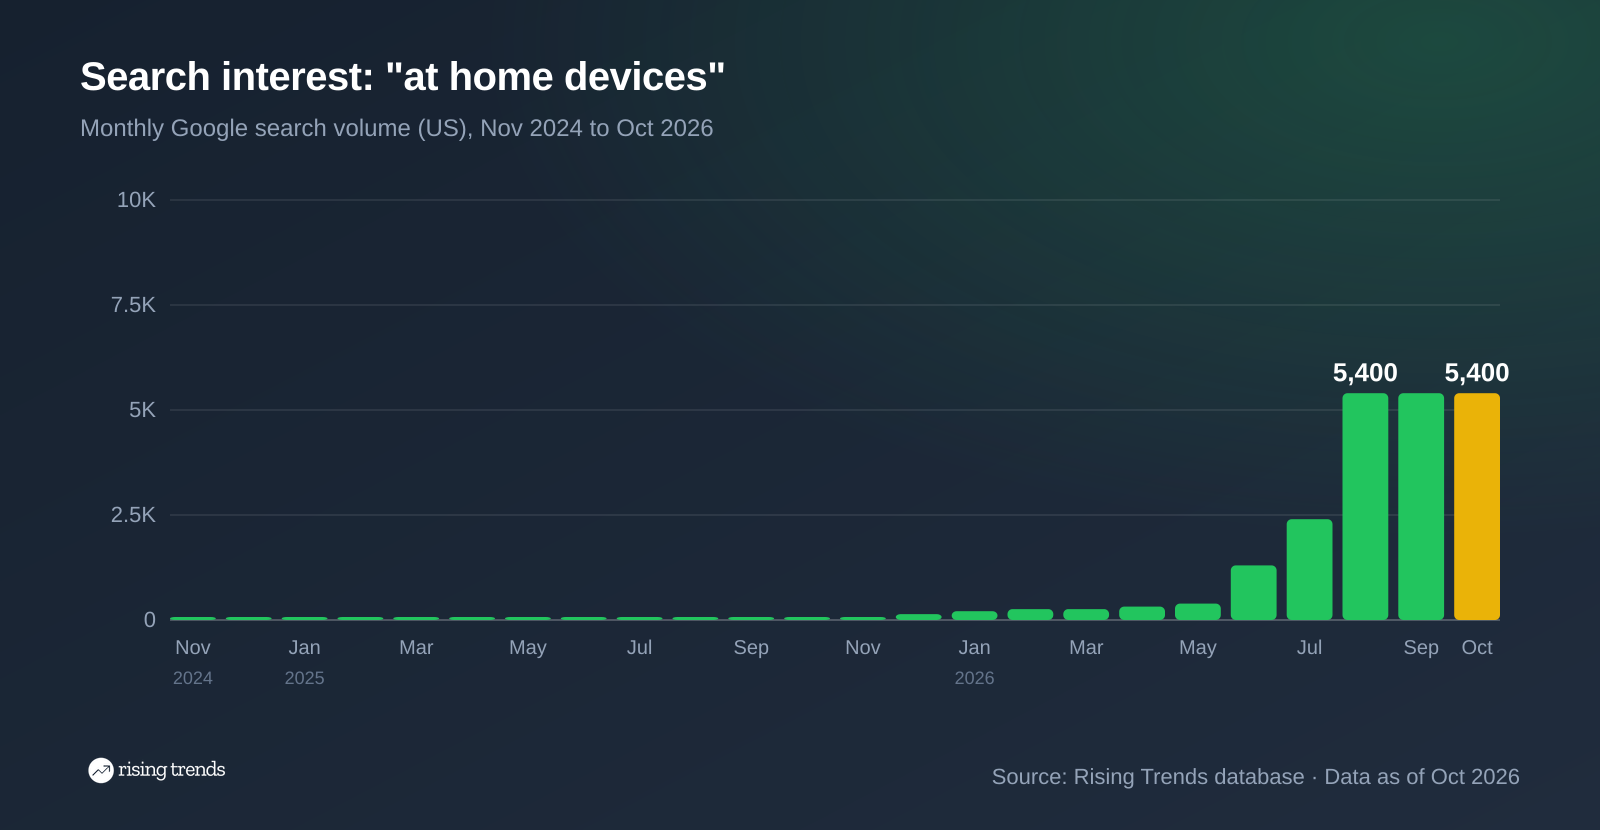
Twenty-four months of small steps. No single month more than tripled the one before it. That shape is what you want before you order inventory, and it is the same rule we apply in our guide to trend forecasting: the floor matters more than the peak.
Step 4: Cut seasonal, flat, declining and spike-driven terms
Now the cuts. Make the assistant apply them against fields it already has, so you are not arguing with a chart by eye.
- Seasonal: the
seasonalityfield reads medium or high, or the curve peaks in the same months every year. - Spike-driven: one or two months carry the whole growth number. The clearest tell is a flat line after the jump.
- Flat: the level changed once and never moved again. A 3-month and 1-year growth of 0% on a big 2-year number means you missed it.
- Declining: 3-month growth is negative and momentum reads slowing or peaked.
- Brand:
is_brandis true.
Example conversation
You
Apply those five cuts to the ten categories. Then check four more I keep seeing recommended: world cup stickers, hydrocolloid roll, magnesium form, bemotrizinol sunscreen.
get_trends { "slugs": ["world-cup-stickers", "hydrocolloid-roll", "magnesium-form", "bemotrizinol-sunscreen"] }
Claude
Cut from the original ten:
- solar device, classroom resources, anti-wrinkle products: one or two step months carry everything. Flat since.
- luxe foundation: holding until the October figure is confirmed rather than estimated.
- coloring blanket: seasonality medium, and only 535 units a month sell across the whole category. Demand is real, the market is thin.
Cut from the four you added:
- world cup stickers (5,400): 165,000 searches in June 2026, 5,400 in October. Down 94% in 3 months. That was an event, not a market.
- hydrocolloid roll (22,200): seasonality high.
- magnesium form (22,200): 27,100 a month since March 2025 and 0% growth over both 3 months and a year. The 2-year figure of +31,614% is one step in early 2025. You are 20 months late.
- bemotrizinol sunscreen (12,100): peaked at 60,500 in June 2026, down 33% over 3 months.
Keeping: at home devices, powerpacks, plug in solar, lymphatic drainage drops, squeezy squishy. Flagging squeezy squishy as cooling, down 33% over 3 months from a June peak.
Five cuts, five survivors. Notice the assistant kept one it also flagged: a cooling term with a real two-year climb underneath is a judgement call, not an automatic no. For the free version of these same checks, our guide on how to find products to sell with Google Trends runs them on the 0-100 index instead.
Step 5: Check the money columns, not just the curve
Demand is half the question. The product-category data carries four more fields that most product research never looks at together: average price, average units sold per month, average monthly revenue, and average customer rating.
The rating is the one people skip, and it is the most interesting. A rising category with a bad average rating means buyers want the thing and the products on sale are not good enough. That is a gap you can fill. A rising category rated 4.6 means the incumbents already solved it.
Example conversation
You
For the five survivors, give me price, monthly sales, monthly revenue and rating. Then tell me which ones have a rating under 4.0 with real demand behind them, because that is where the products are bad.
find_products { "min_volume": 8000, "sort": "sales", "limit": 50 }
Claude
The five survivors, October 2026:
- at home devices: $43.56, 18,550 units a month, $660,067 revenue, rating 4.45
- lymphatic drainage drops: $25.09, 11,900 units, $281,416, rating 4.31
- powerpacks: $24.91, 6,150 units, $148,589, rating 4.54
- squeezy squishy: $14.61, 5,000 units, $66,824, rating 3.88
- plug in solar: $223.43, 1,855 units, $248,211, rating 4.42
Under 4.0 with demand behind it, from the wider scan:
- squeezy squishy: 3.88 across 741 reviews, 27,100 searches, up 135,400% in two years. Rising demand, weak products.
- squishy toys: 3.96 across 2,022 reviews, 201,000 searches, up 805% in a year, 12,750 units a month. Same story at ten times the size.
- nasal dilator: 3.83 across 8,550 reviews, 12,100 searches, 4,535 units a month. But growth is 0% over one and two years and seasonality is high. Stable demand, bad products, no tailwind.
That last block needs demand data and marketplace data in the same query, which is why no product finder gives it to you. Two of the three sit in the same family: the squishy toy category is large, growing and badly served.
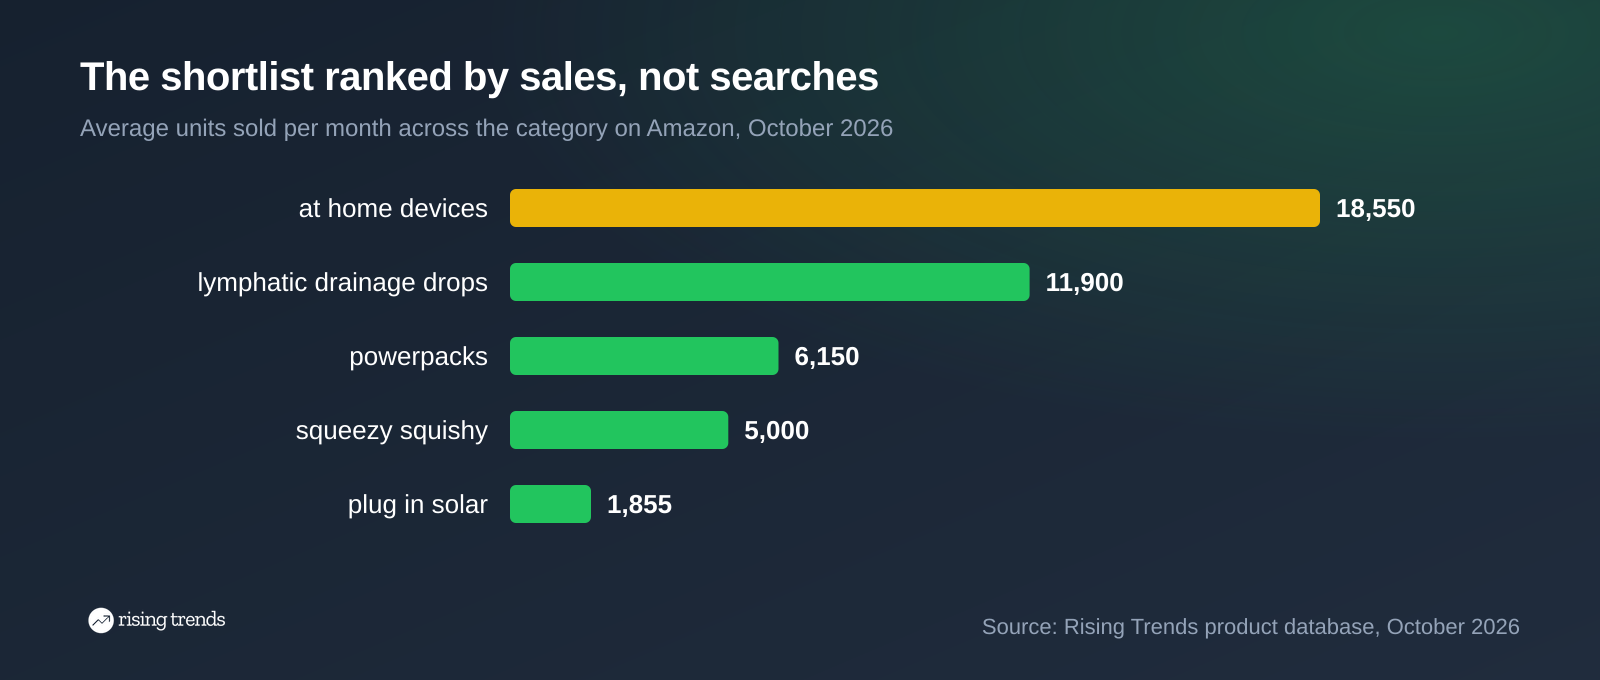
Look at the top and bottom bars. "At home devices" has the smallest search volume of the five, at 5,400 a month, and sells the most units. "Plug in solar" has four times the searches and sells a tenth as many, because it is a $223 purchase people research for weeks. Search volume is interest. Sales are intent. Rank by the one that matches what you are selling.
One caveat on the supplement entry. Lymphatic drainage drops sell well, but supplements carry compliance a blanket or a power bank does not. The FDA states that "under DSHEA, FDA does not have the authority to approve dietary supplements before they are marketed", and that the firm selling them "must have substantiation that the claim is truthful and not misleading". The claims on your listing are your legal responsibility, not your supplier's. Talk to a lawyer before you write a single benefit bullet.
What the AI still cannot do for you
Search data and sales data show demand. Neither shows whether you can make money. Three checks stay on your side of the screen.
Fees. Amazon's own selling plan and referral fee page lists the Professional plan at $39.99 a month and referral fees by category: 15% on Home and Kitchen, 15% on Toys and Games, 8% on Consumer Electronics, and 8% at or below $10 and 15% above for Beauty, Health and Personal Care. On a $14.61 squishy at 15%, that is $2.19 before you have paid for the unit, the shipping or the ad.
Competition. Our data gives you the category's average rating and review count, not who ranks. Search the term yourself. A 3.88 average across 741 reviews is a thin category. A 3.88 across 23,000 reviews means someone big is already there and still failing.
Supply. Nothing in a search curve tells you whether you can source the product at a price that works, or how long the lead time is.
Rising Trends also does not do live social data or ad spend, and our ranking of the best trends MCPs and Claude skills says plainly which servers cover what we do not. Our numbers are monthly and the latest month is an early estimate, which suits picking products you will stock for a season rather than catching this week's viral moment.
Copy-paste prompts
Paste these into Claude or ChatGPT once the connector is on. Swap the category for yours.
Prompt 1: the full method
Using Rising Trends, find product categories in [category] with at least 2,000 US
monthly searches, sorted by 2-year growth. Pull the full monthly history for the top
10. Cut anything seasonal, flat over the last year, declining over 3 months, tied to
one brand, or where one or two months carry the growth. For what survives, give me
average price, monthly sales, monthly revenue and rating. End with 5 products ranked
by monthly sales, each with the searches, the month, the 2-year growth and the
biggest risk.
Prompt 2: find the badly served categories
Using Rising Trends, find product categories with at least 8,000 US monthly searches
and an average rating under 4.1. For each, show monthly sales, review count, and
growth over 3 months, 1 year and 2 years. Keep only the ones still growing over the
last year. These are categories where demand is rising and the products are bad.
Prompt 3: check a product you already have in mind
Using Rising Trends, look up [your product]. Give me monthly searches with the month,
growth over 3 months, 1 year and 2 years, seasonality, momentum, whether it is a
brand, and the average price, monthly sales and rating of the category. Then tell me
plainly whether the curve is a climb or a single jump.
How to run this every month
The method only works if you repeat it. A category that passes every cut today can flatten in a quarter, and the next one is already climbing from 200 searches a month.
- Rerun Prompt 1 at the start of each month for your category and compare it with last month's answer. Anything that was rising and is now flat has peaked.
- Automate it. The same data sits behind the Rising Trends API, so a short script can pull your filters every month and flag the new names before you open a chat window.
- Track the shortlist. Pro tracks up to 100 trends and sends monthly search-volume alerts, so the categories you are watching tell you when they move.
For the finished version of this scan on one niche, see our ranked list of good dropshipping products by real demand, or browse the trending products list directly. If you want to run the same five steps on a service or a software idea instead of a physical product, the sibling guide on how to find business ideas with AI does exactly that. And for the wider picture of where online retail is heading, our retail trends report tracks the category.
FAQ
Can you use AI to find a product?
Yes, but only if you connect it to data. On its own an assistant answers from training data and cannot tell you what people searched for last month. Connected to a search-volume database through MCP, the same assistant can pull real curves, apply your filters and explain which products it cut and why.
How do I find out what products are trending right now?
Ask for product categories sorted by growth over a long window, then check the monthly history for each one before believing the growth number. Sorting by 1-year growth alone surfaces categories that jumped once and stopped. A 2-year window plus the actual monthly numbers is the fastest honest check.
What is the best AI tool to find trending products?
A general assistant such as Claude or ChatGPT plus a data connector beats a one-click product finder. Finders return a fixed list from whatever the vendor ranked that week. With a connector, you set the filters, you see the curve, and you can ask follow-up questions the finder's interface does not have a button for.
Can ChatGPT do Amazon product research?
ChatGPT can do the reasoning but it has no Amazon data of its own. Connect it to a source that carries category price, monthly sales and rating, and it can compare them for you. It still cannot see your fees, your supplier quotes or your ad costs, so the profit maths stays manual.
Is AI product research free?
The assistant can be. The data usually is not. Google Trends is free but gives a 0-100 index instead of search counts, which is enough to see a shape and not enough to size a market. Our guide on how to use Google Trends to find a profitable niche covers how far the free route gets you.
Want to spot the next shift before everyone else? Read our guide on how to identify market trends, or browse what is breaking out right now in our trending topics list.
Never miss a trend again
- One trend broken down with the numbers
- Who's making money, and what to build
- A website on the rise
- A breakout app
Join 5,000+ founders