Trends


Trend forecasting is the practice of reading early demand signals, cultural and quantitative, to work out what people will want before most of the market notices. The professional version runs on expert networks, retail data and a scoring model. The version you can run yourself runs on four measurable tests: lift, acceleration, spread and durability. This guide covers both, and then shows three terms we logged in our database long before they peaked, with the months to prove it.
Key takeaways:
Let's get into it.
A trend forecast is a ranked bet on what gets bigger. It is not a prediction of a single outcome, and the good forecasters are explicit about that: they publish a confidence level alongside the call.
The discipline splits two ways. Macro trends are slow societal shifts, measured over five to ten years: ageing populations, the cost of housing, where people choose to work. Micro trends are the expressions of those shifts in a product category this season, which is where colours, ingredients, silhouettes and feature sets live.
Horizon matters more than most guides admit. WGSN, the forecasting firm most of the fashion and consumer industry pays for, splits its own work into three windows: short term at 0 to 12 months "best for tactical deployment", mid term at 12 to 36 months "best for product design", and long term foresight at 3 years plus for strategy. Search data is excellent in the first window, useful in the second, and close to worthless in the third. If you need a ten-year view, search volume will not give it to you and neither will any tool that sells you one.
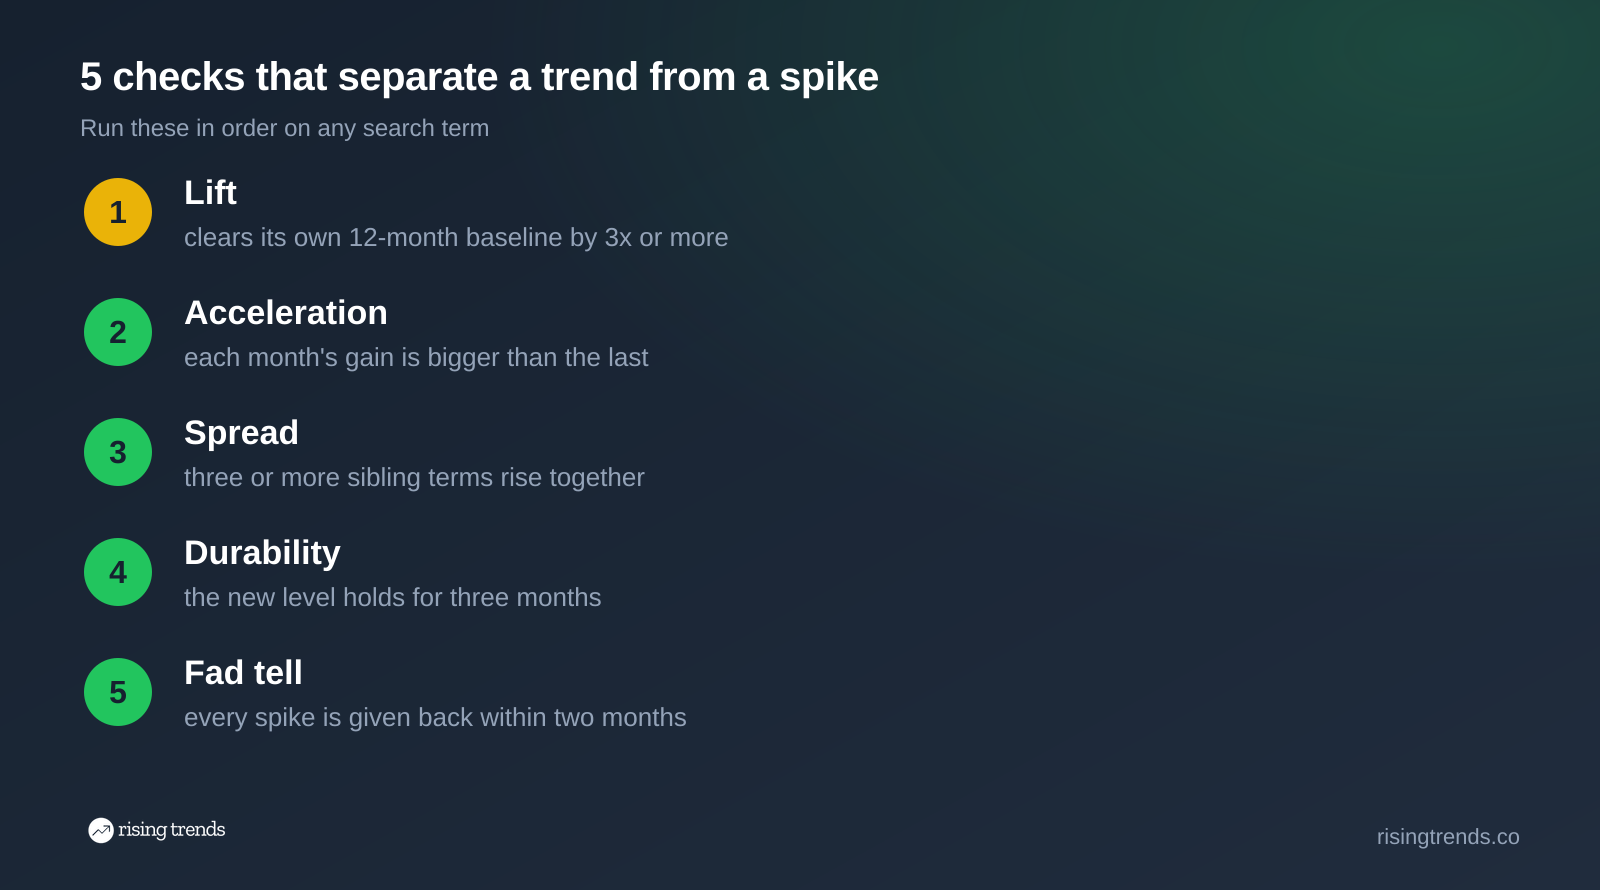
Those five checks are the whole method. The rest of this guide is how to run each one, and what it looks like when they pass and when they do not.
It is worth knowing what you are competing with, and what you are not.
WGSN has run since 1998 and says it is trusted by over 6,500 brands. Its stated method is a blend: "a global network of 250+ in-house, on-the-ground experts" feeding observed signals, plus "multivariate time-series modelling and TrendCurve AI to surface patterns at scale". Inputs include influencer maps, shelf data and catwalk coverage. Every candidate trend is scored against 15 weighted criteria into a WGSN Score from 0 to 100, and only signals scoring 30 or above get published.
Two things in that are worth stealing.
The first is the scoring discipline. They do not publish everything they see. A threshold forces the question "how confident am I" into a number, which is the single biggest difference between forecasting and having opinions.
The second is the claim that the earliest signals do not start on social media, they appear in real life. That is true, and it is also the honest limit of any search-based method, including ours. Search data catches a behaviour at the moment someone goes looking for a word for it. That is early relative to the mass market, and late relative to the person who saw it on a street in Seoul.
What you do not need to compete with is the price tag or the travel budget. The quantitative half of their method is reproducible by anyone with a search database and a spreadsheet.
Google Trends is the default starting point and it is genuinely good at one job: telling you the shape of a curve. It is bad at two others.
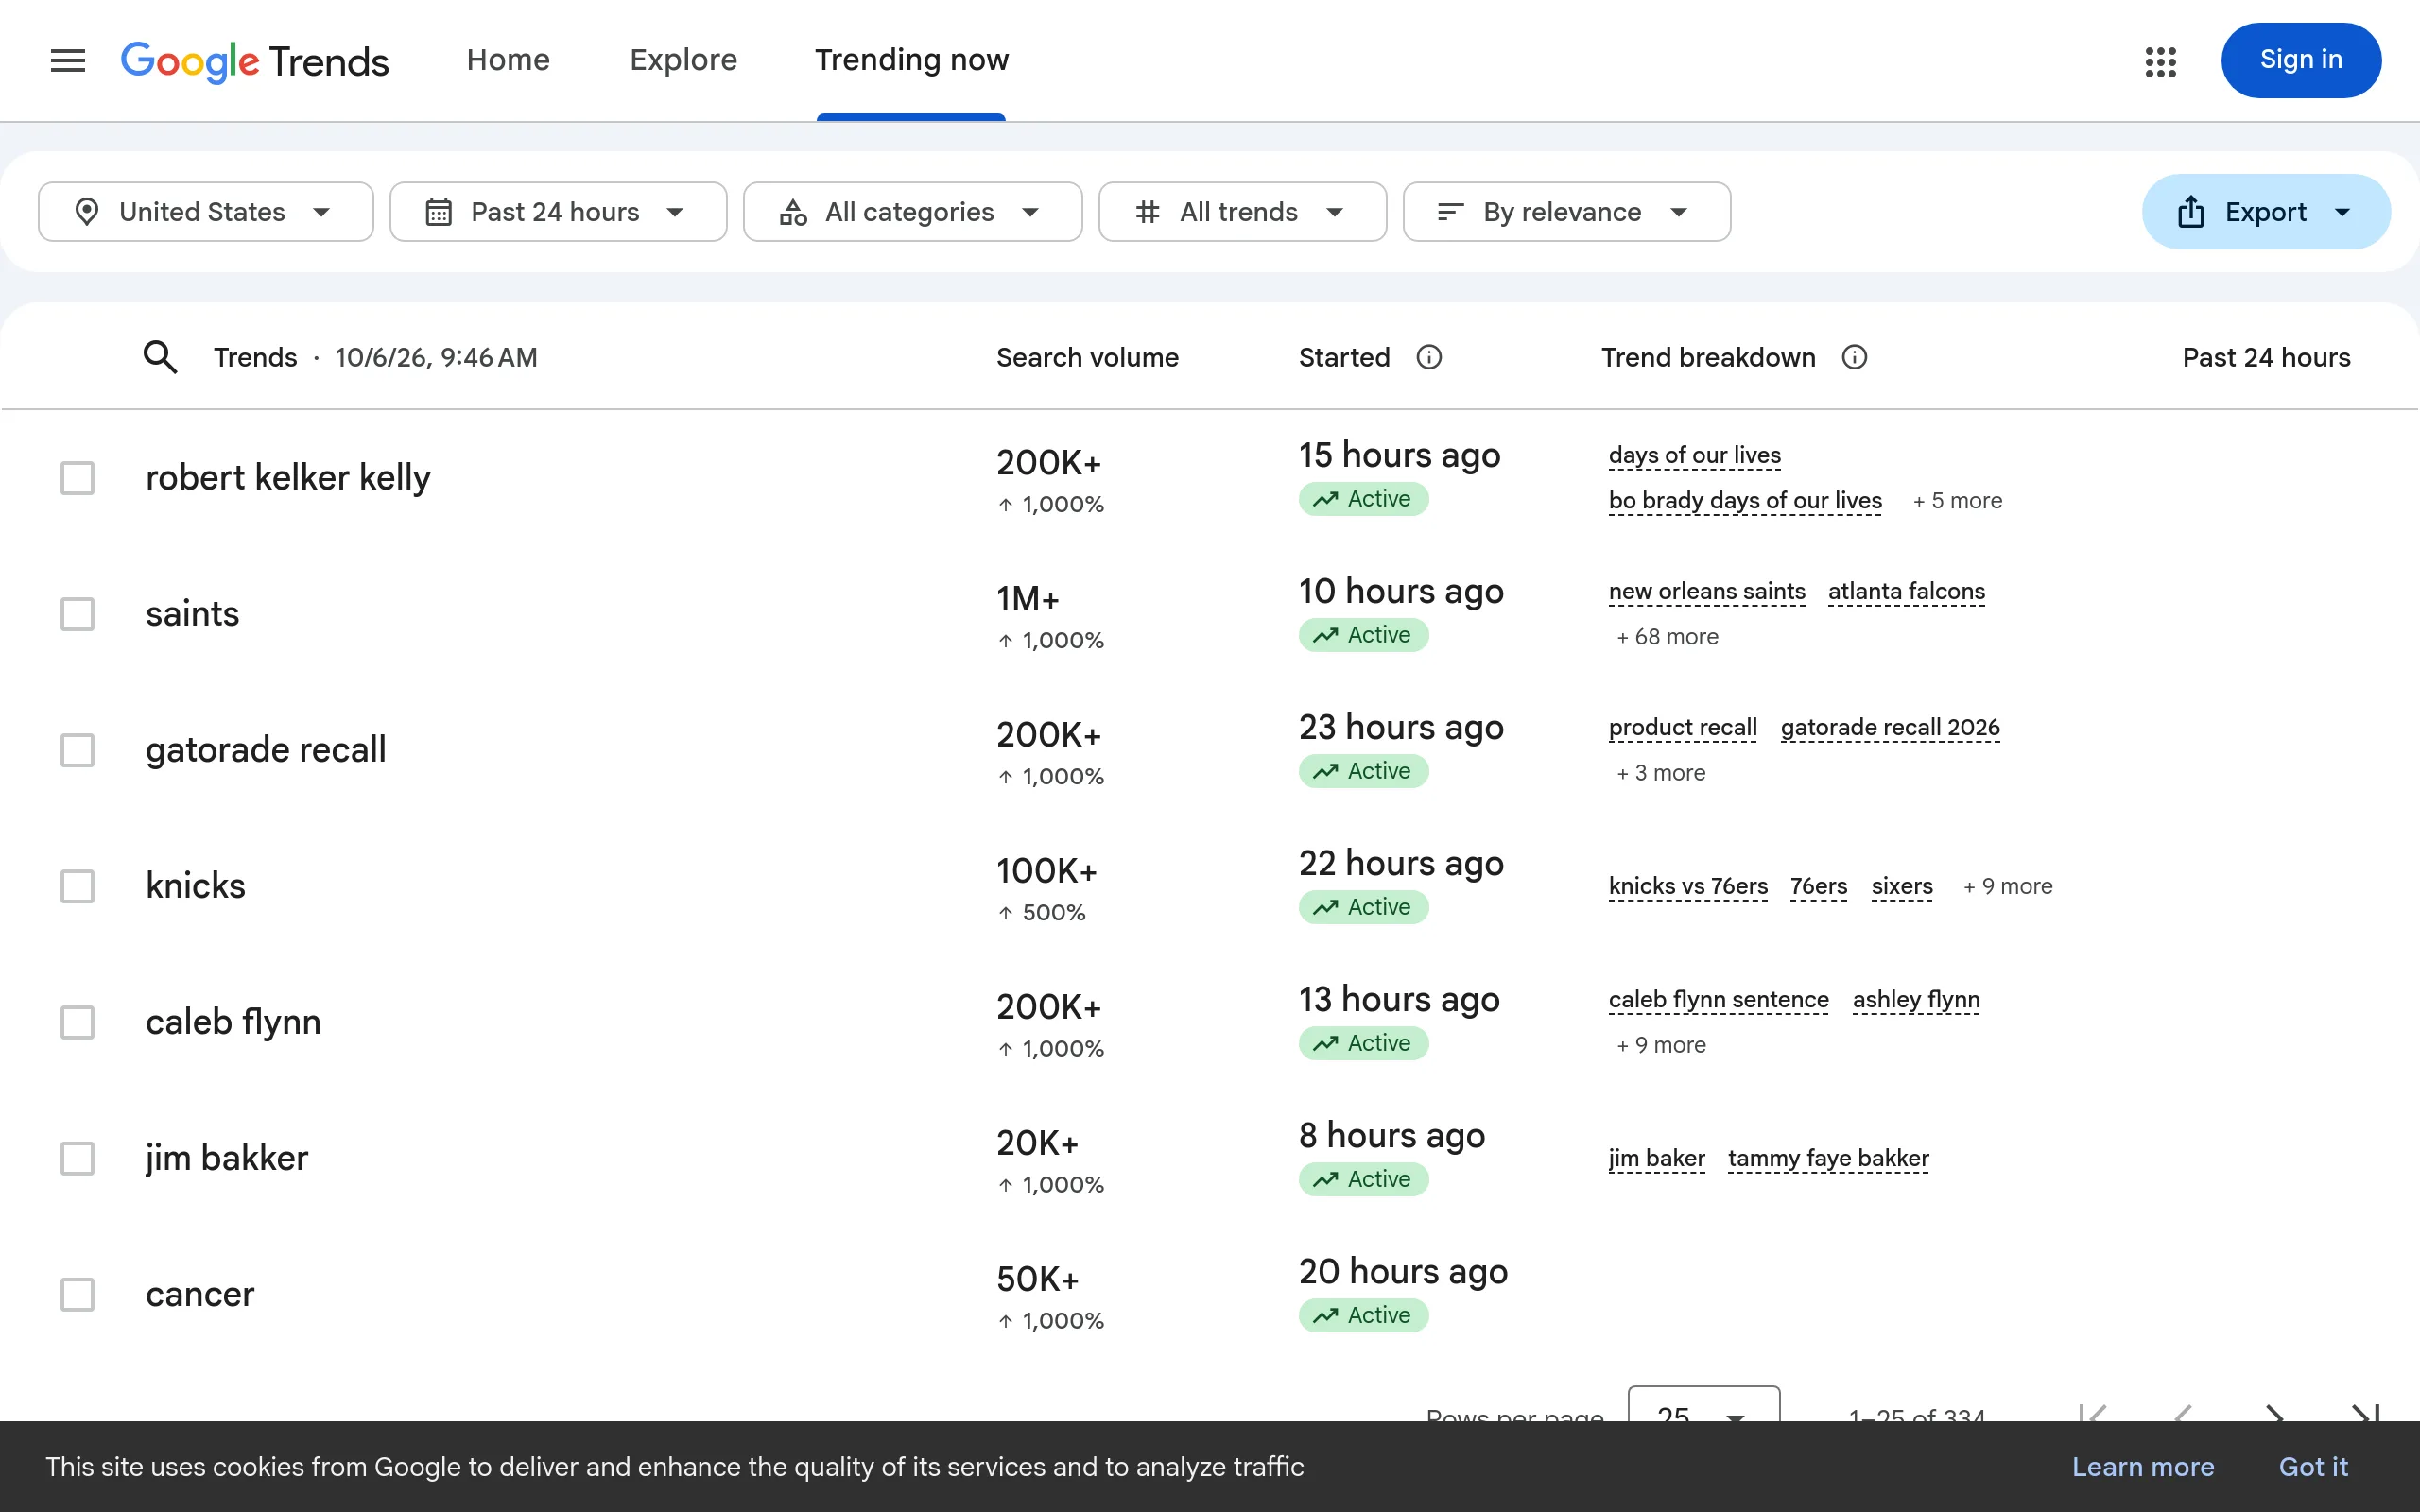
That is the Trending Now page, and it is a good illustration of the problem. Volumes are bucketed (200K+, 1M+), growth is capped at 1,000%, and almost everything on it is a news event from the last 24 hours. News spikes are not trends. They are the thing a trend forecast has to filter out.
The second limit is the one that catches people out. Google's own help centre explains that in an interest-over-time chart, "each data point is divided by the total searches of the geography and time range it represents", and "the resulting numbers are then scaled on a range of 0 to 100". A term sitting at 100 might be getting a thousand searches a month or two million. You cannot size an opportunity with an index, and you cannot compare two charts that each have their own 100.
Our own database stores absolute monthly US volume and the 3-month, 1-year and 2-year growth for every term, which is what makes the tests below runnable. Those figures sit on each term's dashboard trend page, and if you want the wider comparison of what each tool does and does not give you, we have written up the Google Trends alternatives separately.
Take the term's median over the previous 12 months. That is the baseline. A real breakout clears it by 3x or more, and clears it in a single month rather than drifting up.
Why the median and not last year's same month: seasonal terms will beat their own baseline every year on schedule, and you want a test that does not fire every November. "Cheapest gym membership" rises every January. That is a calendar, not a trend.
Lift tells you something moved. Acceleration tells you it is still moving. The test is simple: is each month's absolute gain bigger than the month before it?
"Sovereign ai" went 3,600 in June 2026, 60,500 in July, 201,000 in August. The gains were 56,900 then 140,500. That is acceleration. Compare it to a term that goes 10,000, 20,000, 25,000, 27,000: that is a curve flattening into its new level, which is fine, but you are no longer early.
This is the one that separates a trend from a viral moment, and it is the one almost nobody runs.
A real behaviour change shows up in several phrasings at once, because different people reach for different words for the same thing. A single spiking keyword with flat siblings is usually a news event, a product launch or one video.
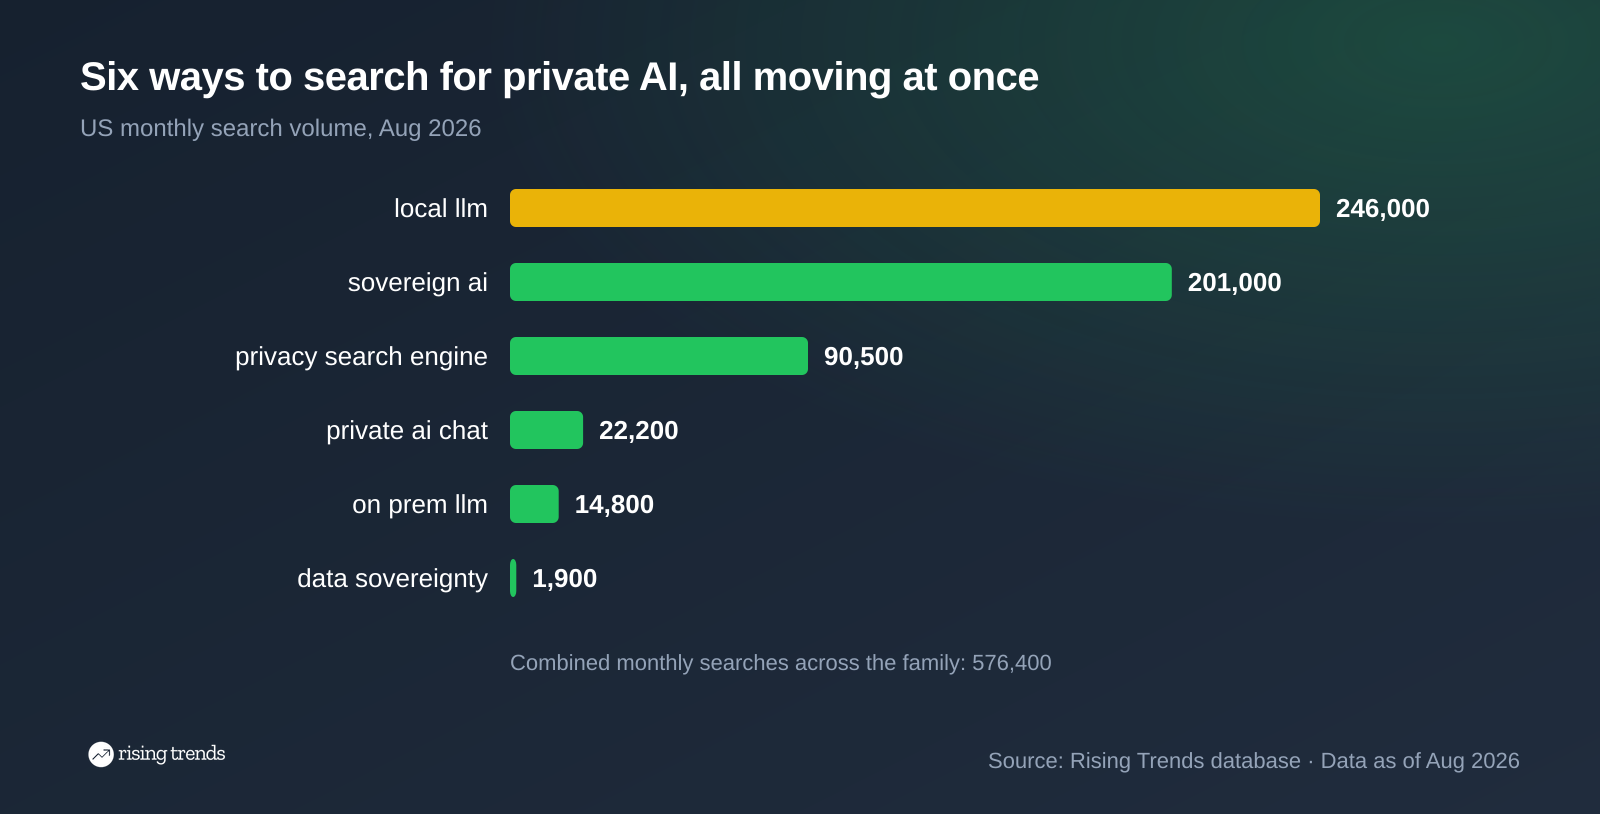
Here is what spread looks like in practice. Between June and August 2026, six ways of asking the same question (how do I run AI without sending my data somewhere) moved together:
| Term | Monthly searches, Aug 2026 | 1-year growth | 2-year growth |
|---|---|---|---|
| local llm | 246,000 | +6,733% | +12,847% |
| sovereign ai | 201,000 | +6,831% | +22,741% |
| privacy search engine | 90,500 | +2,414% | +3,021% |
| private ai chat | 22,200 | +4,525% | +12,959% |
| on prem llm | 14,800 | +8,606% | +21,043% |
| data sovereignty | 1,900 | 0% | 0% |
Five of those six broke out inside the same three months. "On prem llm" went from 170 searches in May 2026 to 14,800 in August. "Local llm" sat between 1,900 and 8,100 for 28 straight months, then went 8,100, 74,000, 246,000.
The sixth row is the interesting one. "Data sovereignty" has not moved at all, holding between 1,900 and 2,900 for 30 months. It is the trade term for exactly the same idea. Industry jargon does not spread, because nobody types it unless they already work in the field. When you build a family to test, build it from the words a normal person would use, not from the words in a vendor's deck. The same principle drives everything on our trending topics list.
The last test is the slowest and the most useful: does the new level hold?
Give a breakout three months. If the term holds most of its gain, you have a trend. If it gives the whole gain back and then spikes again from the old base, you have a recurring viral moment, which is a different business entirely. We cover the longer version of this test in our guide to running a trend analysis.
We added "sovereign ai" to the database on 21 December 2024. It was doing 880 searches a month.
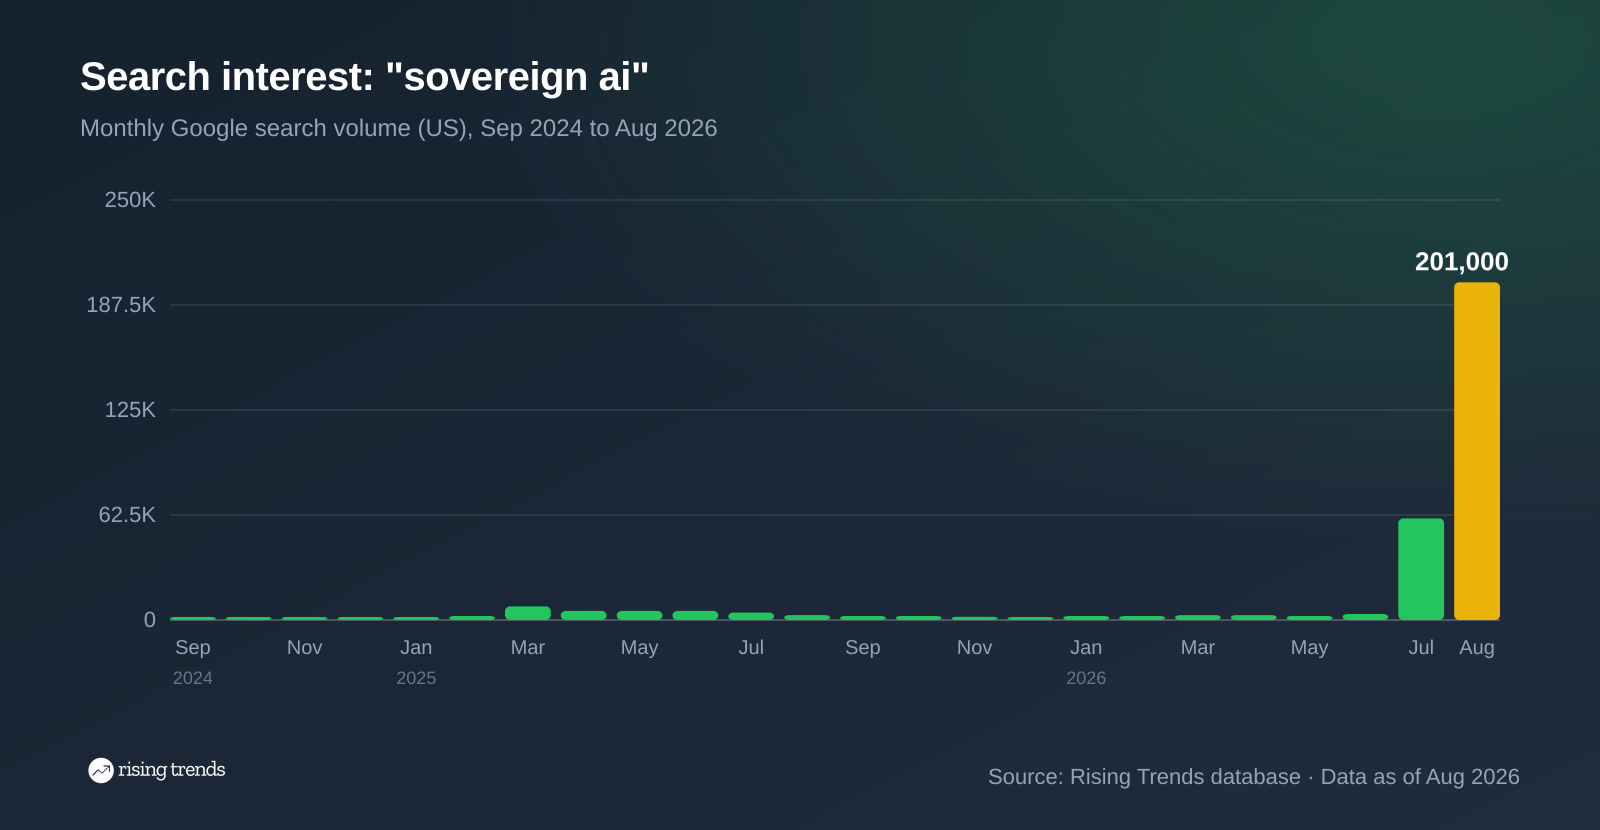
The chart contains the part most case studies leave out. In March 2025 the term jumped to 8,100, which cleared a 3x lift test cleanly. Anyone calling it then would have been right about the direction and wrong about the timing by fifteen months, because it fell back to 1,600 by December 2025 and sat there.
The real move came in July 2026: 3,600 to 60,500 to 201,000. It passed all four tests at once, which the March 2025 jump never did. There was no spread in March 2025. "Local llm" was flat at 2,900, "on prem llm" at 110. The family stayed still, so the signal was one term moving, not a behaviour changing.
A false start that only passes one test is the normal case, not the exception. That is why the four signals are run together rather than as a checklist you can score 1 out of 4 on.
Early detection is the only claim in forecasting that is actually falsifiable, so here is ours with timestamps.
| Term | Added to our database | Volume then | Where it is now (Aug 2026) | Lead time |
|---|---|---|---|---|
| iphone fold | 27 Oct 2024 | 8,100 | 550,000, up 643% in a year | 22 months |
| sovereign ai | 21 Dec 2024 | 880 | 201,000, up 6,831% in a year | 20 months |
| electrolyte drink mix | 1 Dec 2024 | 2,900 | 135,000, after peaking at 201,000 in June 2026 | 18 months |
The electrolyte line is the one that teaches the durability test properly. It broke out in March 2025 (22,200) and April 2025 (135,000), then went through two brutal retracements: down to 27,100 by November 2025, and down to 33,100 in March 2026. Both times it came back higher. A term that recovers from a 70% drawdown to a new high is a trend having a bad quarter, not a fad dying. If you need a steer on acting on signals like that, our write-up on validating market demand covers the commercial side.
Fads pass the lift test. That is what makes them dangerous. The tell is the shape over a longer window.
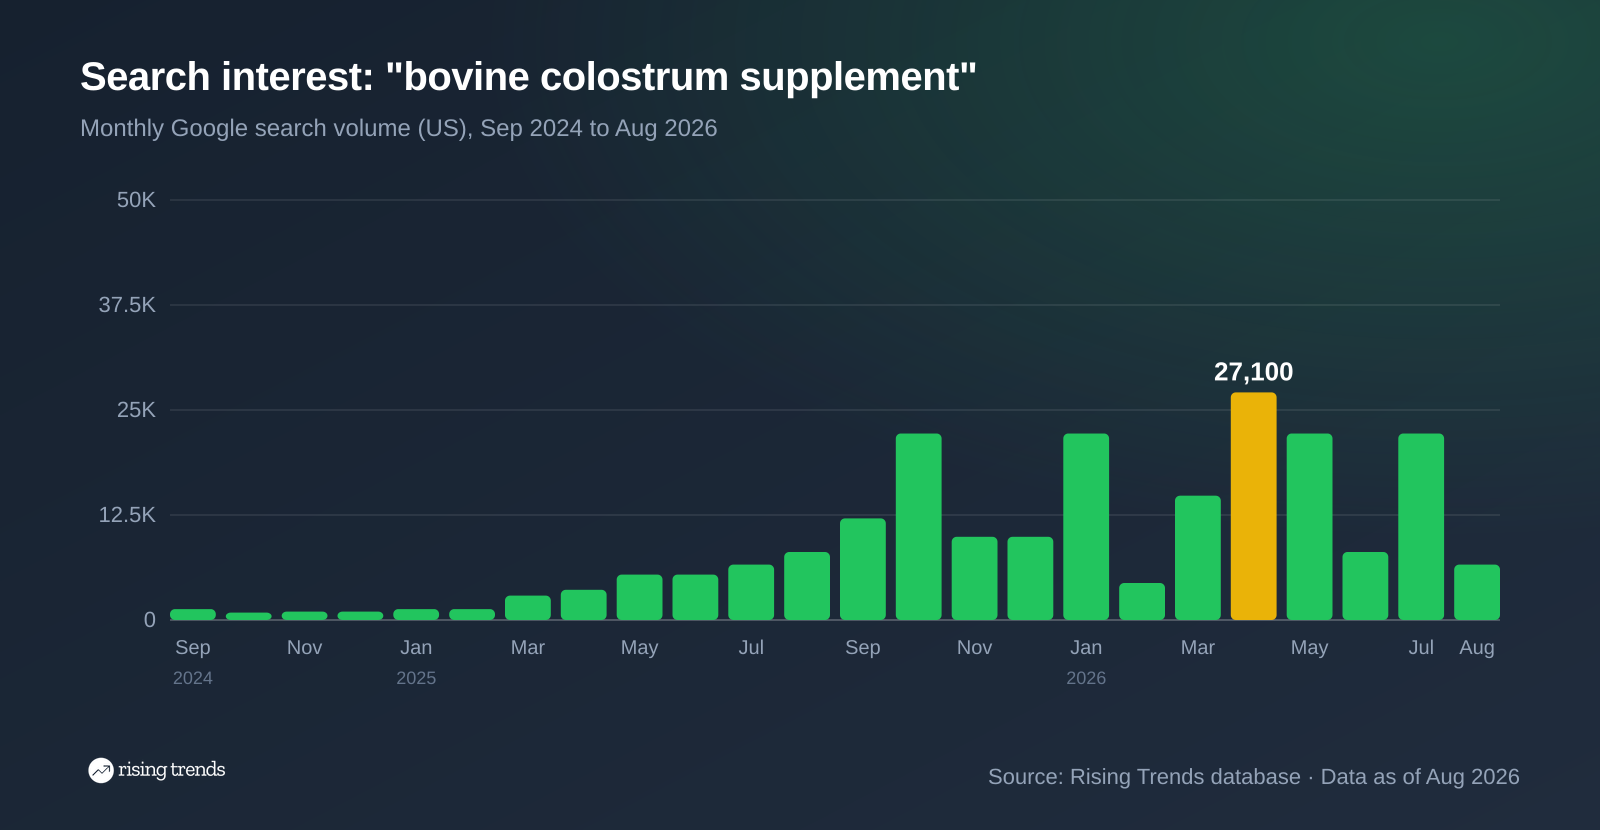
"Bovine colostrum supplement" was at 1,000 searches when we logged it in November 2024, and it genuinely grew: up 560% over two years. But look at the shape. It hit 22,200 in October 2025 and was back to 9,900 in November. It hit 22,200 again in January 2026 and was at 4,400 in February. It peaked at 27,100 in April 2026 and was at 8,100 by June. It hit 22,200 in July and 6,600 in August.
Four spikes, four full retracements, no rising floor. It is down 70% in the last three months. And the family confirms it rather than contradicting it: "colostrum benefits" is down 45% year over year and "colostrum supplement" is down 55%. The siblings are falling together, which is the mirror image of the private-AI chart above.
The broader category still works, which is the nuance people miss. There is real growth across the supplement trends we track. One ingredient inside a growing category can be a fad while the category is a trend.
Two models get used, and they describe the same arc from different ends.
The retail trend cycle is introduction, rise, peak, decline, obsolescence. It is descriptive and it is what buyers and merchandisers use, because it maps onto when you place orders and when you discount.
The Gartner Hype Cycle names the same five stages from the expectations side: Innovation Trigger, Peak of Inflated Expectations, Trough of Disillusionment, Slope of Enlightenment, Plateau of Productivity.
| Stage | What the search data looks like | What to do |
|---|---|---|
| Introduction / Innovation Trigger | Low volume, erratic, long-tail phrasings only | Log it and watch. Do not commit stock |
| Rise / Peak of Inflated Expectations | Lift plus acceleration, family starting to move | This is the window. Build, write, buy |
| Peak | Growth flattens, head term dominates the family | Competition arrives. Margins start compressing |
| Decline / Trough of Disillusionment | Volume falls, "is X worth it" and refund queries rise | Harvest, do not reinvest |
| Obsolescence / Plateau | Settles at a floor well above the original baseline, or near zero | The floor is the real market size |
The stage that pays is the second one, and it is short. For sovereign AI it was about two months.
Four failure modes account for most of it, and three of them are avoidable.
For a structured walkthrough of the research process around these, start with our guide on how to identify market trends, and if you are comparing the paid forecasting platforms, we have reviewed the Trend Hunter alternatives and the TrendWatching alternatives.
Forecasting is a habit, not a project. The useful version is a short list of terms you re-test on a schedule, which is a thing you can automate.
The Rising Trends API returns the same figures used throughout this guide. This pulls every term in a category growing more than 500% over the last year, biggest growth first:
curl -H "Authorization: Bearer rt_live_your_key" \
  "https://www.risingtrends.co/api/v1/trends?category=Artificial%20Intelligence&min_growth_pct=500&timeframe=1y&sort=growth&order=desc&limit=25"
Swap timeframe to 3m to catch acceleration rather than year-long moves, and add min_search_volume=5000 to drop the noise. Run it weekly, diff it against last week, and the new rows are your candidates. Then run the four signals on each one by hand, because no filter can judge spread for you.
If your watchlist is about products rather than concepts, the same approach works on the trending products list, and there is a product-specific walkthrough in our guide to finding products to sell with Google Trends.
Someone whose job is to identify what consumers will want in a future season or quarter, and to translate that into decisions a business can act on: what to design, what to stock, what to price. In fashion and consumer goods the role is usually qualitative and research-led. In tech and finance the same job title sits closer to data analysis.
The US Bureau of Labor Statistics does not track "trend forecaster" as its own occupation, so the closest official figure is market research analysts. BLS puts the median annual wage at $78,760 in May 2025, with employment projected to grow 7 percent from 2025 to 2035. Agency trend forecasting roles in fashion tend to sit below that at entry level and well above it at director level.
There is no licence and no single path. The common routes are a design or merchandising background moving into the research side, or a market research and analytics background moving into consumer insight. What is portable is the evidence: keep a dated file of calls you made, what you based them on, and whether they came good. A record of ten timestamped calls with five hits is more persuasive than any course certificate.
It depends entirely on your horizon. For 3-year-plus strategic foresight, the paid qualitative services (WGSN and its competitors) are what the industry buys, and search data will not substitute for them. For the 0 to 12 month window, where most commercial decisions actually get made, quantitative search tools are better and far cheaper, because they are measuring behaviour rather than interpreting it. We compare the options in our rundown of Exploding Topics alternatives.
We do not publish an annual list of predictions, because a list written in January is stale by March. What we publish instead is what is measurably growing right now, updated weekly, with the volume and growth attached to each term. As of August 2026 the clearest quantitative story in our data is the private-AI family above: six terms, a combined 576,400 monthly searches, and most of that movement arriving in a single quarter.
Want to run these four tests on your own list? Read our guide on how to identify market trends, see the live sovereign ai trend page, or browse what is breaking out right now on the Rising Trends dashboard.
Thousands of Emerging Trends
Thousands of Breakout Apps
Mega Trends
Trend Analysis Tool